The EDPS dashboard
To install the EDP dashboard (a.k.a. EDPS-GUI), please follow the instructions given here. To launch the dashboard, type:
. <path-to-environment>/bin/activate
edps-gui
The <path-to-environment> is the full-path-name of the virtual environment defined during the installation procedure.
The EDPS dashboard is then loaded on a browser window fig-gui. To start EDPS, press the
Start EDPS green button at the top of the window. To stop EDPS,
press the Stop EDPS red button and press Ctrl-c on the terminal
where the edps-gui command was launched.
At the top of the Dashboard, close to the Start/Stop EDPS button there is the Workflow selection menu, which allows to load the desired workflow. The available workflows depend on the pipelines installed in your system.

The EDPS dashboard (Graphic User Interface). At this stage, EDPS has not been started yet and no workflow has been selected.
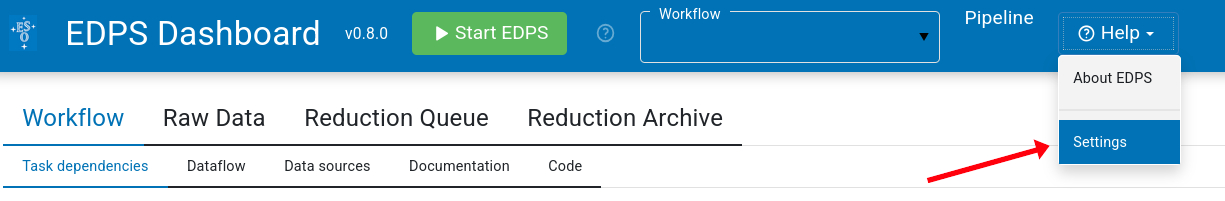
The “Help” drop-down menu contains version information, reference, and the Settings menu, which allows to configure several EDPS behaviors, such as links to data-storage directories, and the parallelization. It is described in detail in Section Settings. Note that it is possible to change the settings only if EDPS has not been started yet.
There are 4 tabs in the main dashboard window, they are:
Workflow. It gives information on the workflow, the graphic layout, a description of the type of data and access to the workflow code. It is described in detail in Section The Workflow tab.
Raw Data. It allows to specify the input data, the preferences for association calibrations, and to create datasets to be reduced. It is described in Section The Raw Data tab.
Reduction Queue. It starts the data reduction. It is described in Section The Reduction Queue tab.
Reduction Archive. It gives access to previously archived data reduction and final products. It is described in Section The Reduction Archive tab.
At the bottom of the dashboard, the graphic representation of the selected workflow is visible.
Settings.
Several options in EDPS can be specified in a configuration file, named application.properties.
This file is located in the .edps/ directory in your HOME directory.
It is possible to modify the file directly through the EDPS-GUI, by selecting the menu “Settings” in the drop-down menu “Help” at the top of the GUI.
Note, the file can be edited only if EDPS is not running; press the “Stop EDPS” red button if necessary. In the following, we describe the most important configuration variables. After the settings are changed, press the SAVE button to save. They new values will be used when pressing “Start EDPS” the next time.
Location of products and database: The base_dir and path variables.
This is the folder where EDPS saves all the products of all the executed jobs (specified via base_dir), as well as it keeps a database with the information of the various reductions (specified via path). These are specified at the first execution of the EDPS-GUI, but it might be convenient to change it, e.g. if the selected location has no more space. Obviously, if new values are specified, all the information stored in the previous location is no longer visible. It is recommended to specify full paths, otherwise a new directory will be created everytime on the path the EDPS-GUI is launched from.
Association preference: RAW vs MASTER calibrations.
Note: it is recommended to specify this variable via the GUI, before creating the datasets (see here), and not by editing the application.properties file.
If the input directory contain both MASTER (e.g., pre-reduced calibrations) and RAW calibrations, it could happen that both of them fulfill the matching criteria and quality level for a certain task. In this case, one can specify to which type of calibration to give priority by setting the variable association_preference in the configuration file.
Possible values of association_preference are:
raw. First, EDPS checks if there are raw calibrations ensuring the first quality level (see here) of the products. If found, they are associated. If not found, raw calibrations ensuring the second quality level of the products are searched. If not found, the next level is searched until the last quality level is reached. If no raw calibrations are found for none of the quality levels, then EDPS searches for master calibrations, starting from those ensuring the first quality level. If none are found, the second level is searched, and so forth. If no calibrations are found, the association is not done.
master. Same as raw, but first master calibrations are looked for all the products quality levels permitted by the workflow parameter quality_threshold. Then, if master calibrations are not found, the system looks for raw calibrations.
raw_per_quality_level (default). First, the system will check if there are raw calibra- tions ensuring the first quality level of the products. If not found, MASTER calibrations en- suring this level are searched for. If not found, RAW calibrations ensuring the second quality level are searched for, if not found MASTER calibrations matching the second quality level are searched for. The sequence goes on until the last level permitted by the workflow parameter quality_threshold.
master_per_quality_level. Same as raw_per_quality_level, but with inverted roles for MASTER and RAW calibrations. If a combination of RAW and MASTER calibrations are present, the value of association_preference might have an impact on the performances and the quality of the results. Typically. association_ preference = raw_per_quality_level delivers the best quality products, at the price of speed. On the other hand, association_preference = master ensures faster performances, at cost of quality (e.g., a very old master calibration could be used instead a more recent raw calibration). If only RAW or MASTER calibrations are present in the input directories, then the value of association_ preference has no impact.
Parallelization One of the advantages of EDPS is that it can exploit powerful hardware. The following variables in the application.properties file determine the pararellization of EDPS reduction.
processes (default: 1). It specifies the maximum number of jobs to run in parallel (e.g. esorex parallel executions) .
cores (default: 1). It specifies the maximum numbers of computers cores to use, considering all the parallel jobs.
default_omp_threads (default: 1). The number of cores to use for each job. This can be overridden by specifying a recipe parameter OMP_NUM_THREAD for a given task when configuring the reduction.
The optimal configuration depends on the system and on the instrument pipeline (e.g., whether it is parallelized or not).
In case of parallelized pipelines, we recommend to reserve to EDPS the full number of cores (minus 1). Set 2 processes in parallel, and default_omp_threads to about 1/2 of cores.
In case of non parallelized pipelines, we recommend to reserve to EDPS the full number of cores (minus 1). Set the number of parallel processes as the number of allocated cores, and default_omp_threads to 1.
Order of executions. The variable ordering in the application.properties file specifies the priority to give to the reduction jobs. The most important values are:
dfs. depth-first, gives preference to reaching final reduction target quicker. In other words, it finish the reduction of a dataset before moving to the next dataset. This choice is less efficient in time but it gives priority to the reduction of individual datasets.
type. It gives preference to following the reduction cascade level by level making sure to pro- cess same type of data together (eg. first all biases).
dynamic. Immediately runs whichever job is ready (has all needed inputs), no stalling but the order is unpredictable. This is the most time efficient execution order.
Go to top
Go to EDPS-GUI documentation index
The Workflow tab.
This tab gives information about the workflow, that can be accessed by clicking on the available sub-tabs:
Task dependencies. It shows the connection between each task and sub-workflows. The tasks are the individual processing steps that run a specific pipeline recipe. A sub-workflow groups tasks of similar purposes to simplify the overall data flow structure. Each sub-workflow is also illustrated with the relations between the tasks within it.
The tasks descriptor indicates the name of the task, the recipe, the main input and the associated inputs. The descriptor also indicates whether an associated input has to satisfy a certain condition to be associated (e.g., a calibration X is associated only if the user specifies it in the preferences, or if the main input is obtained with a certain instrument setup). Descriptor for the subworkflows indicates the tasks within it, and the corresponding main inputs and recipes.
The color of the lines connecting tasks and subworkflows mirror the color they have inside the descriptors.
fig-workflow-tabshows an example of this tab.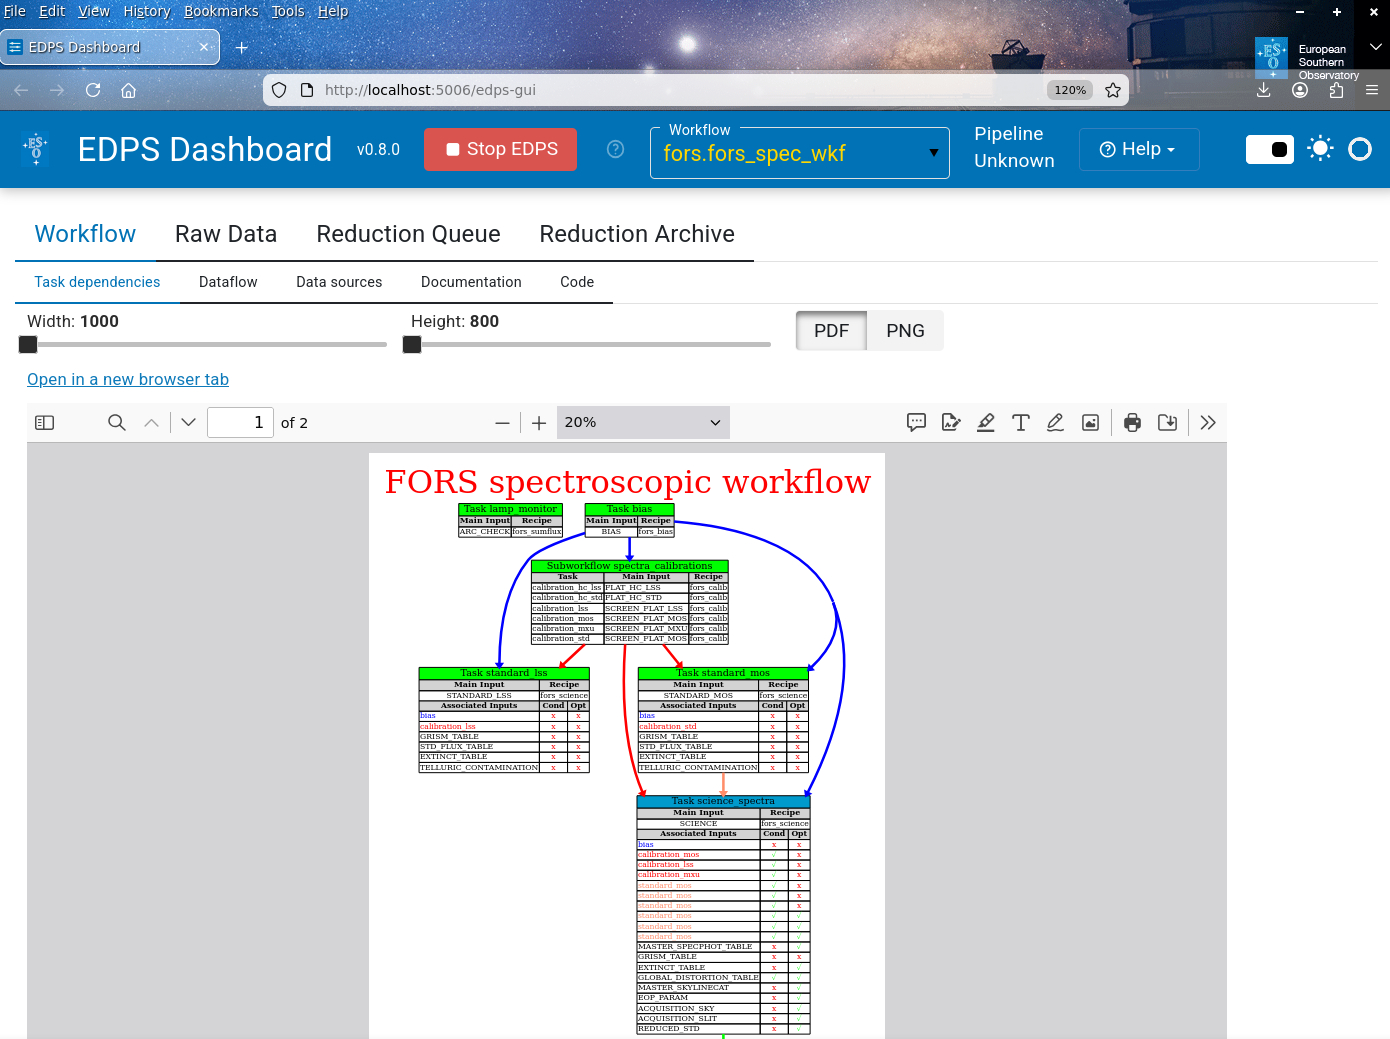
The EDPS dashboard, showing part of the task dependencies within the FORS2 spectroscopic workflow.
Dataflow. It is a simpler representation of the workflow. It shows the categories of the data sources of the raw data, the individual tasks (in green) and the subworkflows (in orange). It provides a global view of the data reduction chain.
fig-load-flowshows an example of this tab.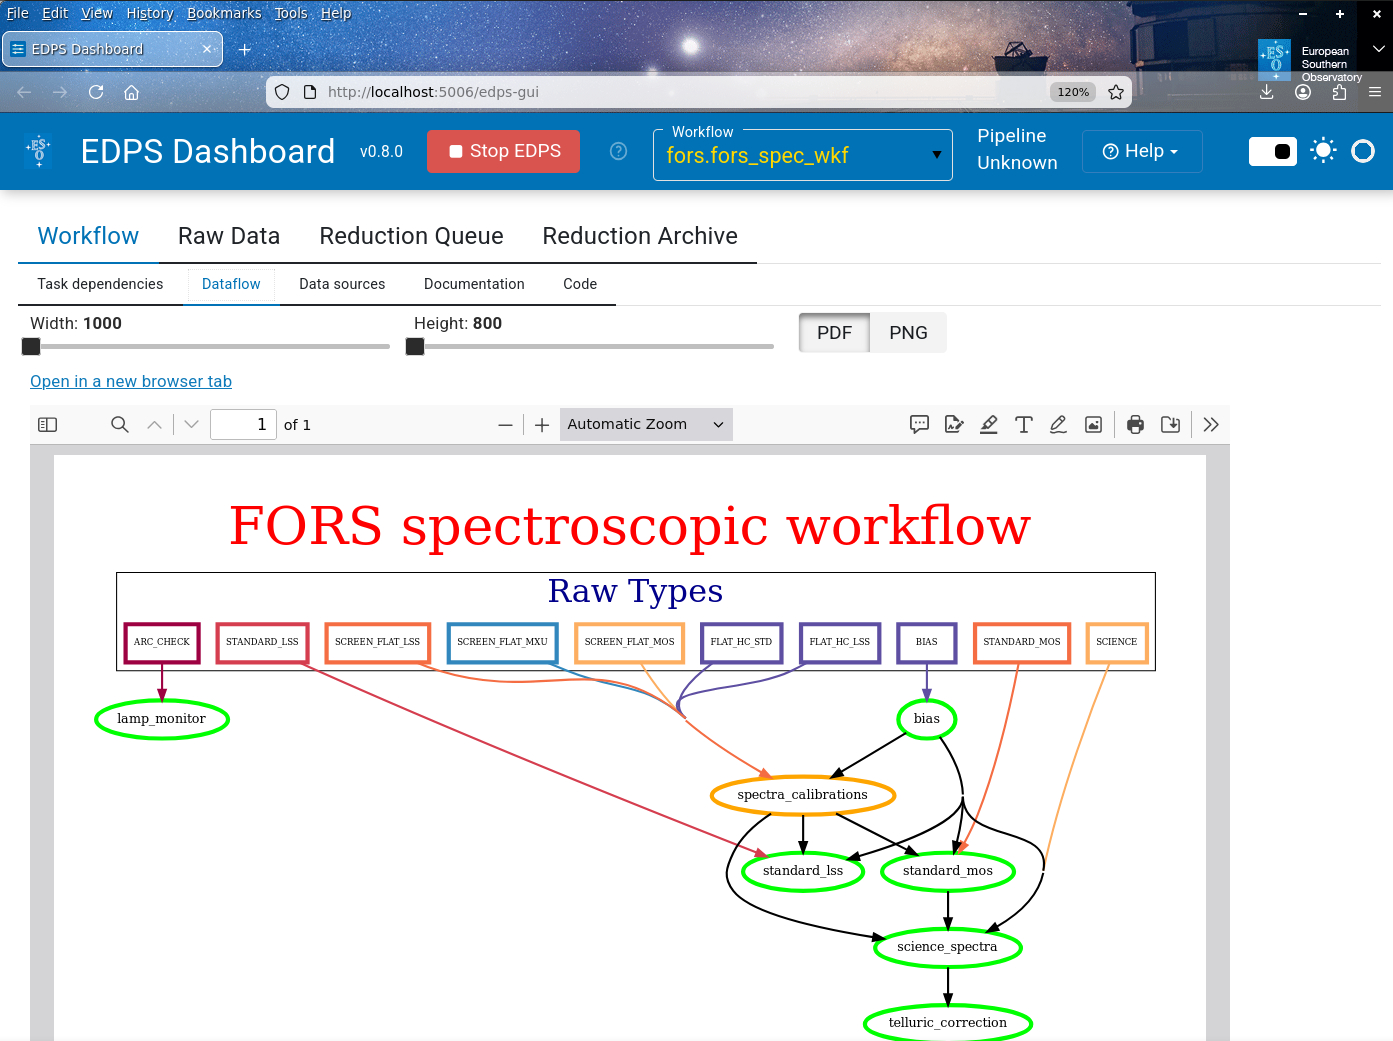
The EDPS dashboard, showing the top-level data flow structure of the FORS2 spectroscopic workflow.
Data sources. It shows the association map, with the definition of the various datasources, their properties such as
Classification. The types of files that belong to this datasource. The classification is the tag assigned to the file used by the processing recipe. Note that a single datasource (e.g. SCIENCE) can include files with different classifications (e.g., SCIENCE_LSS, SCIENCE_MOS, SCIENCE_MXU), as they are processed by different algorithms by the pipeline recipe (fors_science).
setup. The list of header keywords used to recognize the instrumental setup used to obtain those observations.
grouping. The list of header keywords used to group the files within the same classification. Files of the same group (e.g. that have the same value of the header keywords in this list) are input to the same recipe execution.
Task. The name of the task that have that datasource as main input. Note that a datasource can be the main input of more than one task.
Recipe. The name of the recipe executed to process that datasource. Because a datasource can be the main input of more than one task, it can be processed by more than one recipe.
Static calibrations. Association map between static calibrations, datasources, and tasks. An
xindicates that that static calibration is needed by a given task to process a given datasource.
Documentation. Links to the relevant documentation files for that pipeline.
Code. It shows the Python code of each file in the workflow. The dropdown menu
Select fileallows to select the file to inspect. Files cannot be edited from the GUI. If changes are needed, edit the file with an external editor, close and reopen the EDP-GUI for the modification to have an effect.
Go to top
Go to the EDPS-GUI documentation index
The Raw Data tab.
This tab allows to specify and inspect the input data, to specify how deep into the reduction cascade to go (reduction target), to configure the association preference, and, finally, to create the dataset to reduce.
There are 5 main buttons:
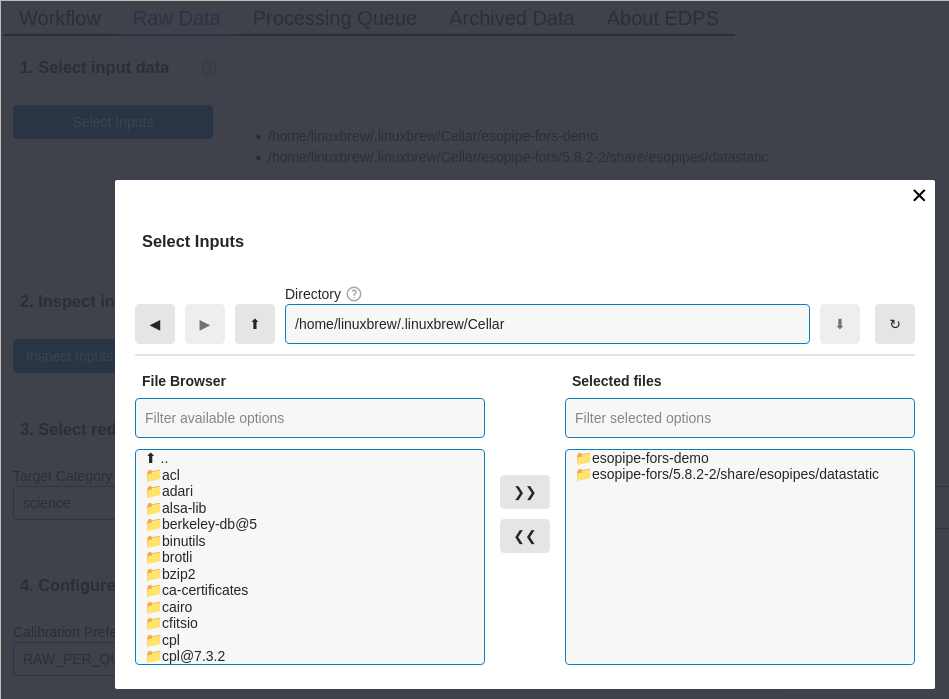
Select the input data. The button “Select Inputs” opens a window that allows to specify the directory where the input data are located.
Inspect the input data. The button “Inspect Inputs” allows to inspect the input files. Press this button and a table with the the list of input files appears. The first part of the table shows the list of the input files, grouped by category. Click on the arrow of each category to show the files within. Buttons on the left side of each file allows to visualize it either with
fvords9(if present in your system).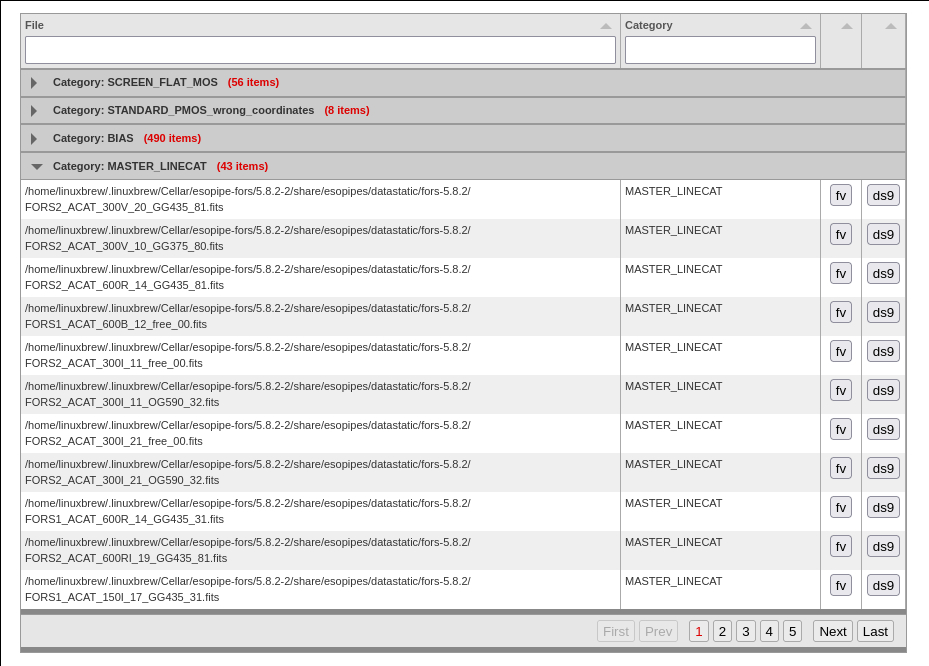
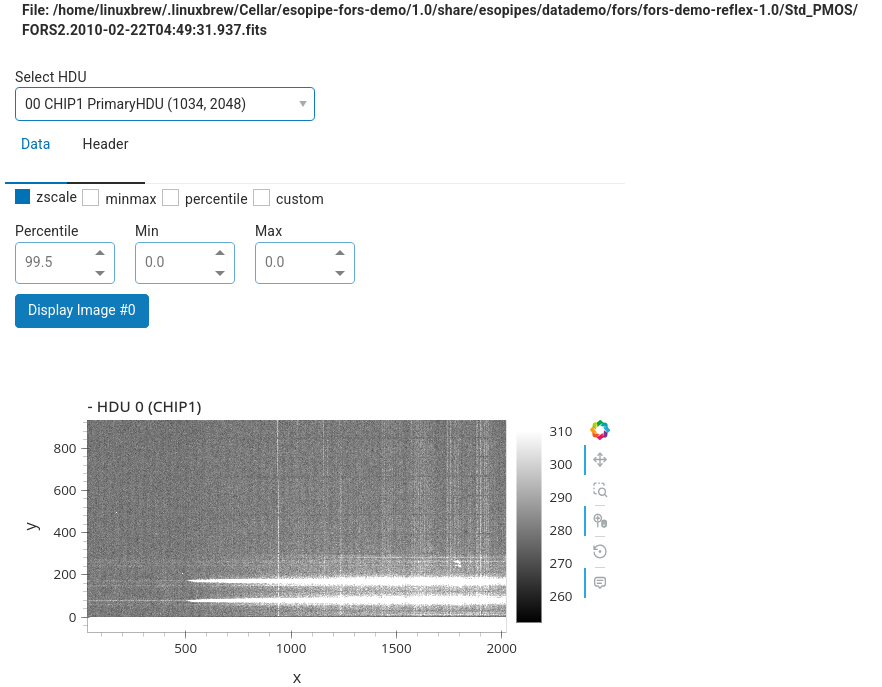
The second part of the table allows to inspect the headers of the various extensions, and also it allows to inspect the data extension with interactive Python tools.
Select reduction target. This window allows to specify the final steps of the reduction cascade, the so-called “target tasks”. The tasks, i.e. the various steps of the reduction flow, are grouped by categories, which can be selected from the drop-down menu “Target Category”.
EDPS processes all the data until the specified target tasks, and triggers all the tasks down in the reduction cascade that are needed to trigger the target task. For example, if the target task is “science”, and the reduction cascade foresees that also the “bias” and “flat_field” tasks are needed to provide the necessary calibrations, then EDPS will process all and only the biases and the flat fields that are needed to reduce the science data. If there are other biases or flat fields that are not needed for the specified science exposure, they are not reduced. On the other hand, if the specified target task is “flat field”, then EDPS will reduce all the flat field exposures, plus all and only the biases that are needed for those flat fields.
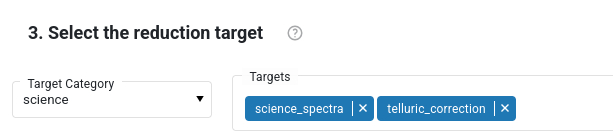
Individual tasks within that category are listed in the “Targets” bar. In the figure below, the “Science” category is shown, that contains the tasks called science_spectra and telluric_correction. The categories and the tasks depends on the loaded workflow. The category “science” is specified by default. The category “all” shows all the tasks in that workflow. Tasks that are not desired, can be removed from the list. The category “qc1calib” triggers all the calibration and instrument monitoring tasks, but it does not process scientific images. Other target categories are specific for Paranal operations, and are not needed for the general user.
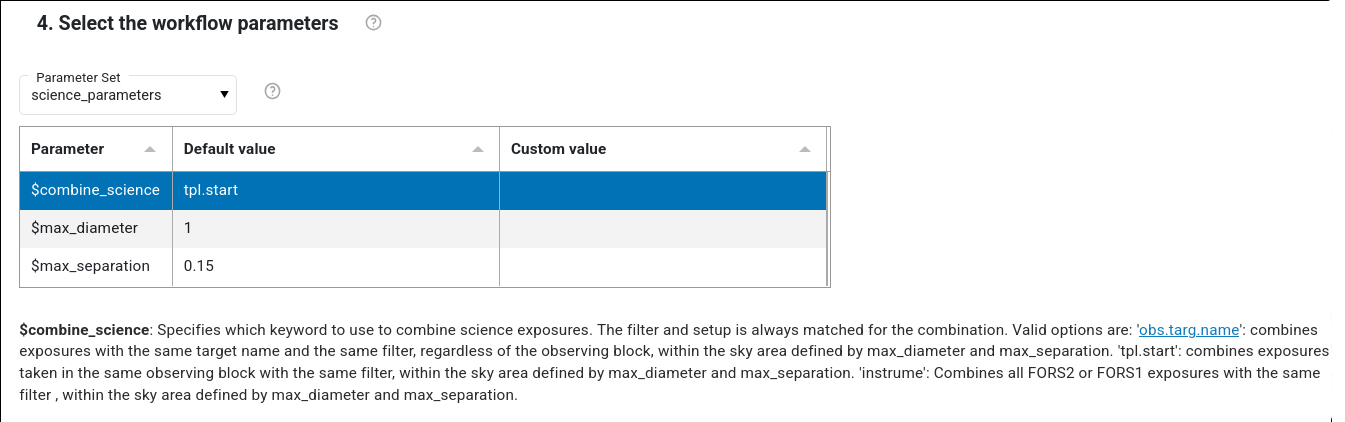
Select the workflow parameters This windows allows to specify the so called “workflow parameters”, e.g. parameters that define the strategy of the reduction or, as in case of fors (see figure below), the criteria on how to group files to combine. Workflow parameters can influence which files enter a dataset. Click on the parameter name to visualize a short description. Every workflow has a different list of workflow parameters.
There are several “Parameter sets” that can be selected, e.g. sets whose parameter values are predefined according to specific use cases. By default, the “science” parameter set is loaded, which contains the settings for the most science use cases. This is the recommended parameter set to use or, eventually modify. Other parameters sets are qc0_parameters (for quick inspection at Paranal), idp_parameters (the set used by ESO to populate the science archive), default_parameters (to automatically process calibrations in Chile). Other workflows might contain additional parameters sets, depending on the use case. Note that the parameters shown in this window are only the workflow parameters, e.g. those that can determine the content of the dataset. Other parameters (e.g. recipe parameters) can be configured in the Reduction Queue individually for each dataset (see here).
Create Dataset. This steps creates the datasets to be reduced until the specified reduction target.
The menu “Calibration preference” allows to specify the preferences in associating calibrations (e.g., raw or master calibrations). The various preferences are described here. For regular science reduction the options raw_per_quality_level (default) or master_per_quality_level are recommended.
Press the “Create Dataset” blue button to create the datasets. Datasets, together with all the calibrations needed to process them, are listed in a table. Selected datasets can be sent to the processing queue by pressing the “Submit to Reduction Queue” blue button.
Important notes:
When submitting a dataset, the reduction ‘does not start automatically’. To process a dataset, please, go the the Reduction Queue tab.
You cannot submit to the Reduction queue datasets that are already submitted.
If datasets are already generated, the “Create dataset” button is not active. Because a dataset is defined by the reduction target and the files it contains, to generate new datasets, one has either to specify new input files, change workflow parameters that change the way files are included (e.g., different combination strategy) or change the association preference.
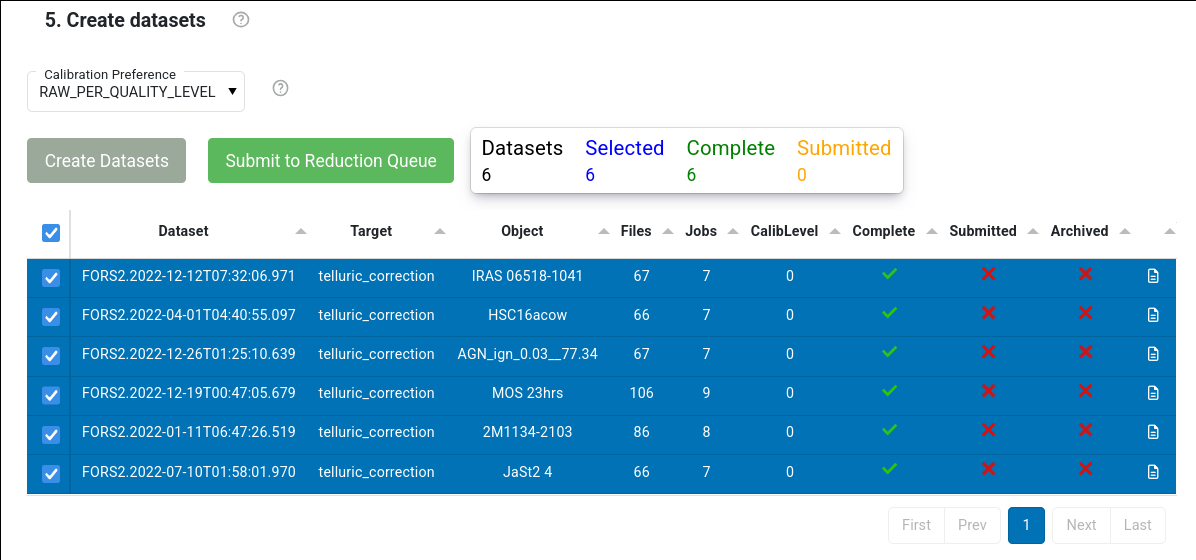
The table shows information about the number of jobs, of files, if a dataset is complete, if it has been submitted to the reduction queue, of whether the final products have been archived. It also indicates the CalibLevel, i.e. a number indicating the quality of the associations for that datasets. If CalibLevel is 0, it means that all the associations are within a “safe” time interval foreseen by the calibration plan of that instruments. Higher numbers indicate associations of lower quality. More information on the levels of associated calibrations can be found here .
The content and the file association within a dataset can be inspected by pressing the button
 at the end of each dataset row. This shows the association tree as in the figure below.
Incomplete datasets are marked in red, with the indication of what is missing.
at the end of each dataset row. This shows the association tree as in the figure below.
Incomplete datasets are marked in red, with the indication of what is missing.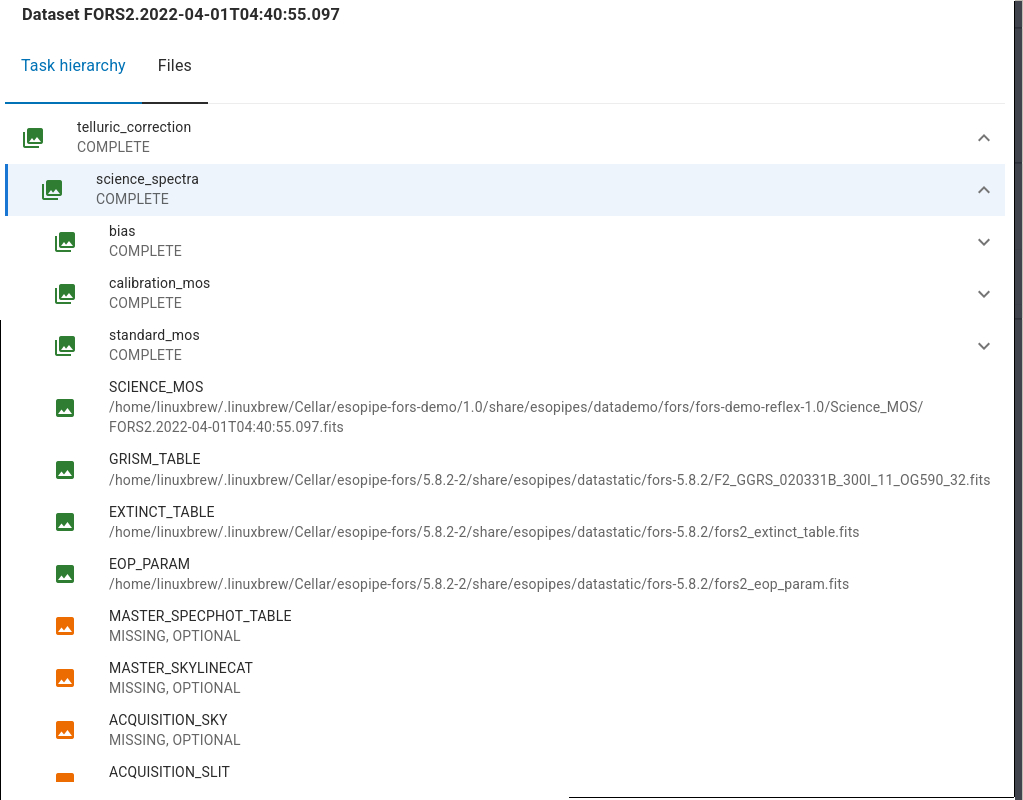
Go to top
Go to the EDPS-GUI documentation index
The Reduction Queue tab.
The *Reduction Queue main page is shown in fig-processing_queue:
The main table shown in this page lists all the datasets that are in the queue.
Each dataset has a list of “configurations”, e.g. the individual reductions
of that same dataset with different parameters.
Each dataset configuration has a status, that could be either:
“new”: the configuration has never been processed yet.
“completed”: the reduction of that dataset with that configuration has been sucessfully executed.
“pending”: the reduction is scheduled but no jobs has been executed yet
“running”: the reduction has started, some jobs have been completed, some jobs are running and other pending.
“failed”: the reduction terminated but some jobs have failed.
“aborted”: the reduction was aborted.
Only “new”, “aborted” or “failed” configurations can be reduced. “Completed” configurations can be modified: in this way a new configuration is created and can be processed.
At the end of the raw of each configuration, the button  allows to specify the
data reduction parameters for a given dataset, and therefore it allows to create a different configuration for the same dataset.
See here for more details on how to configure the reduction.
allows to specify the
data reduction parameters for a given dataset, and therefore it allows to create a different configuration for the same dataset.
See here for more details on how to configure the reduction.
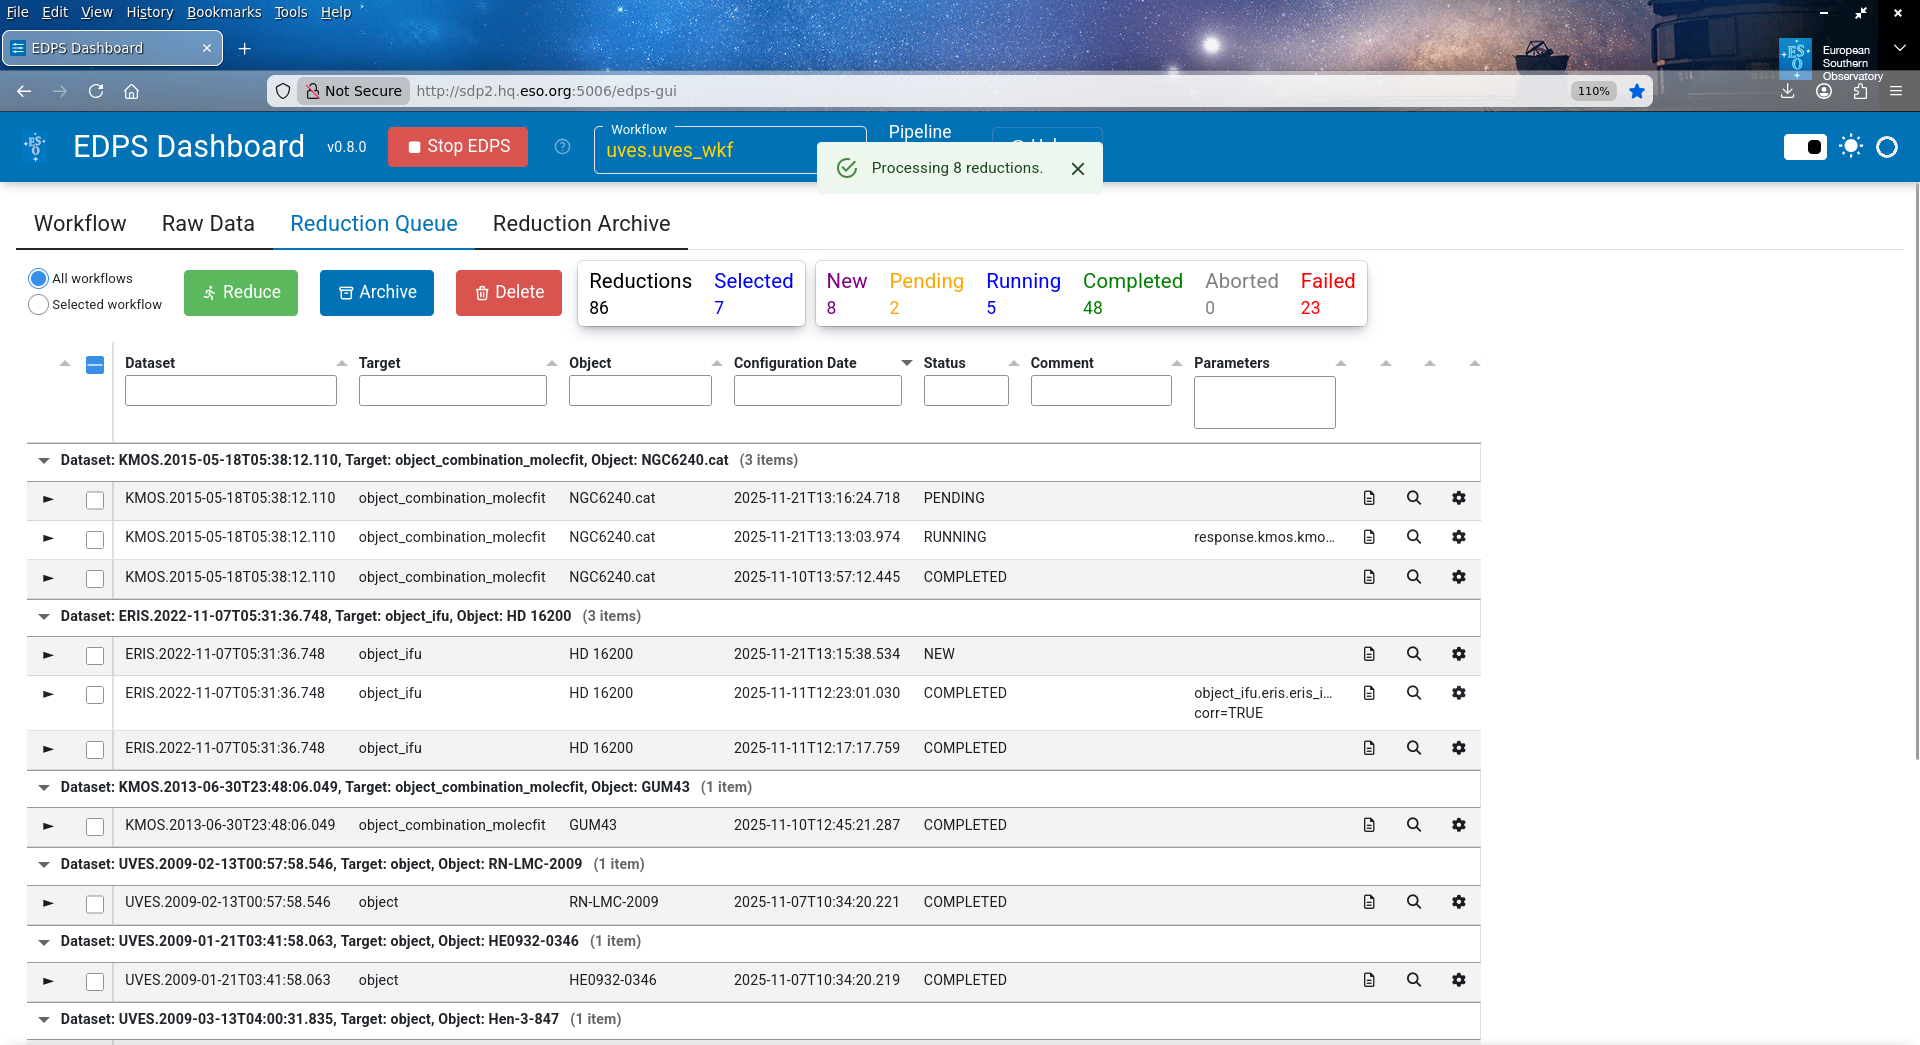
The Processing Queue main tab. The top part shows the datasets and their configuration listed for processing and the main command buttons. The configuration status is reported. The lower part indicates the reduction progress.
After creating a new configuration, press the button  to start the reduction of all the selected
datasets.
The expand button
to start the reduction of all the selected
datasets.
The expand button  next to each configuration, allows to see the list of the tasks and their status.
The button with
the magnifying lens
next to each configuration, allows to see the list of the tasks and their status.
The button with
the magnifying lens  next to each task, shows the graphic report associated to that specific
reduction step.
On the other hand, the same button next to the dataset, shows the graphic report of the last step of the data reduction.
next to each task, shows the graphic report associated to that specific
reduction step.
On the other hand, the same button next to the dataset, shows the graphic report of the last step of the data reduction.
The button next to each dataset allows to inspect the various products of the reduction, as done for the input data (see here).
The results of a reduction can be stored in a desired location by pressing the button  (see
Section Reduction Archive for further information).
(see
Section Reduction Archive for further information).
Go to top
Go to the EDPS-GUI documentation index
The Reduction Archive tab.
All the products (final and intermediate) of all reduced configuration for all datasets are saved into the EDPS_data directory. In addition, EDPS offers the possibility to “archive” a desired reduction (e.g., the one that gives the best results) by “exporting” only the final reduction products into another location.
Select the desired reduced configurations and press the “Archive button”. This configuration disappears from the Reduction Queue and appear in the tab “Reduction Archive”.
The content of the “Reduction Archive”, e.g. the list of archived reductions, can be inspected by pressing the **Reduction Archive” tab.
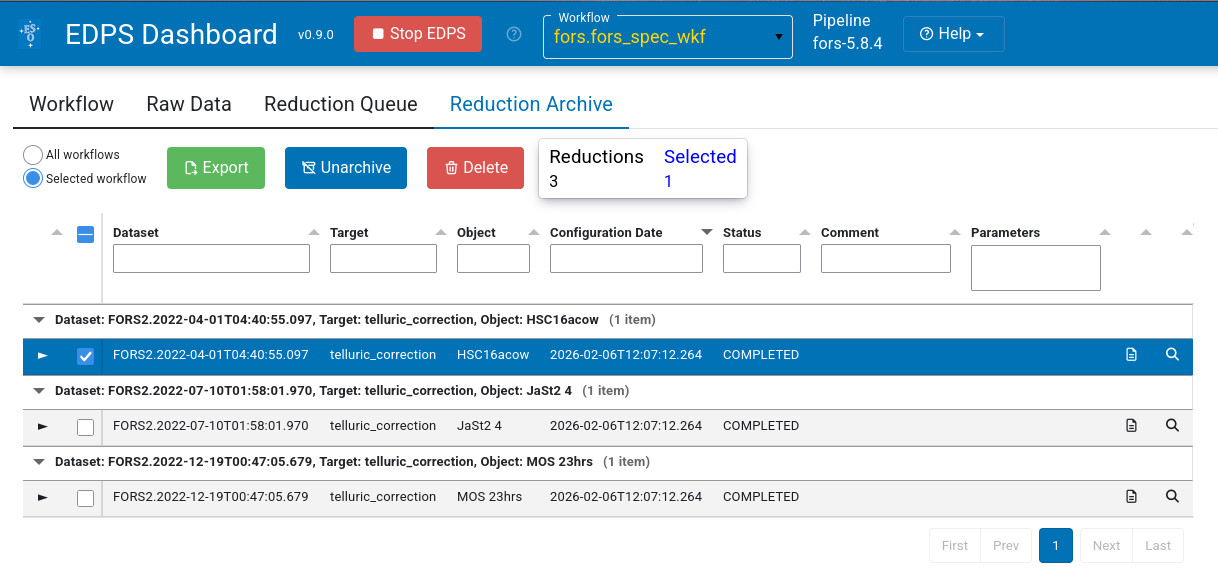
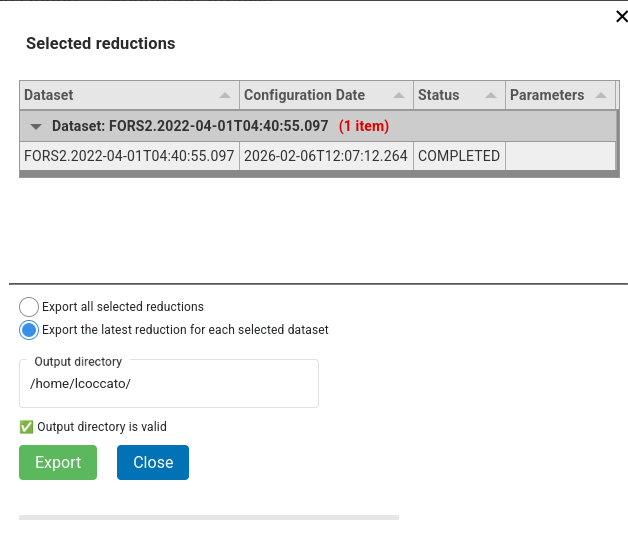
Each configuration and its jobs can be inspected, unarchived and eventually deleted. In order to copy the final products into a desired location, press the Export button. A window will appear allowing
to select all or just the last configuration for the selected datasets
to specify a directory where to save the files. A check is done
Press Export to save the files..
The types of files to copy depend on each workflow. Typically, only most important files of the
scientific tasks are saved. Other files can be found in the EDPS_data directory.
The operation can take several minutes, depending on the sizes of the files.
The default structure is <dataset_name>/<reduction_time_stamp>/<category>.fits.
Go to top
Go to the EDPS-GUI documentation index