Reducing demo data
This section describes how to quickly reduce the ESPRESSO demo data that come with the ESPRESSO pipeline. It is recommended after installing the pipeline to first process the demo data in order to verify the installation of the pipeline and the EDPS. This is a good first training step for users who are dealing with the instrument for the first time, and only small modifications are needed (changing the path to the input raw data directory) for processing any other data set.
We assume that the EDPS GUI, the ESPRESSO instrument pipeline, and the demo data that come with the pipeline have been installed on the user’s system. General instructions on how to accomplish these steps are available here.
Go to top
1. Setting up the workflow
a. After installation and while still in the installation virtual environment (if not, activate it again), start the EDPS dashboard by typing:
edps-gui
The EDPS dashboard will start in a browser window.
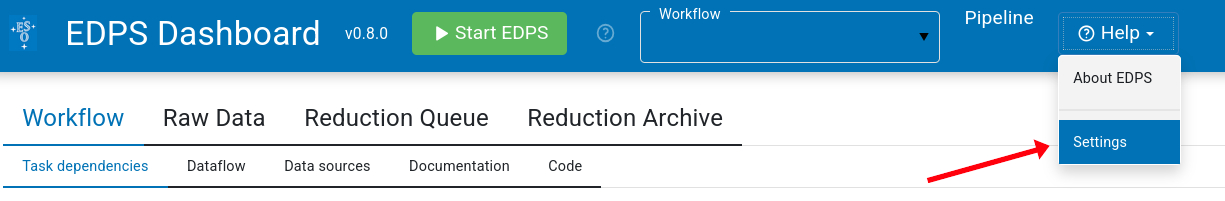
b. Optionally, before starting EDPS, one can specify new settings by pressing Help –> Settings (see here)
c. On the browser window with the EDPS dashboard, press the button Start EDPS.

d. Select the necessary pipeline workflow from the Workflow
pull-down menu (with a black background in the figure below):

The pull-down menu should list the workflows for all installed pipelines, as seen in the example above. If only one pipeline is installed, the user will see only the workflows that belong to that pipeline. A single pipeline can include multiple workflows; in the example above, there are two mode-specific FORS workflows. In case of doubt, the user can verify which pipelines are accessible in this installation by typing in a terminal:
esorex --recipes
and see the recipes from which pipelines are listed.
Once the selection is made, a graphical workflow representation will appear underneath.
In the case of ESPRESSO, the espresso.espresso_wkf should be selected. The corresponding graphical workflow representation is shown below (only the beginning of the workflow is shown). The user has the option to resize it or to select between PDF and PNG formats.
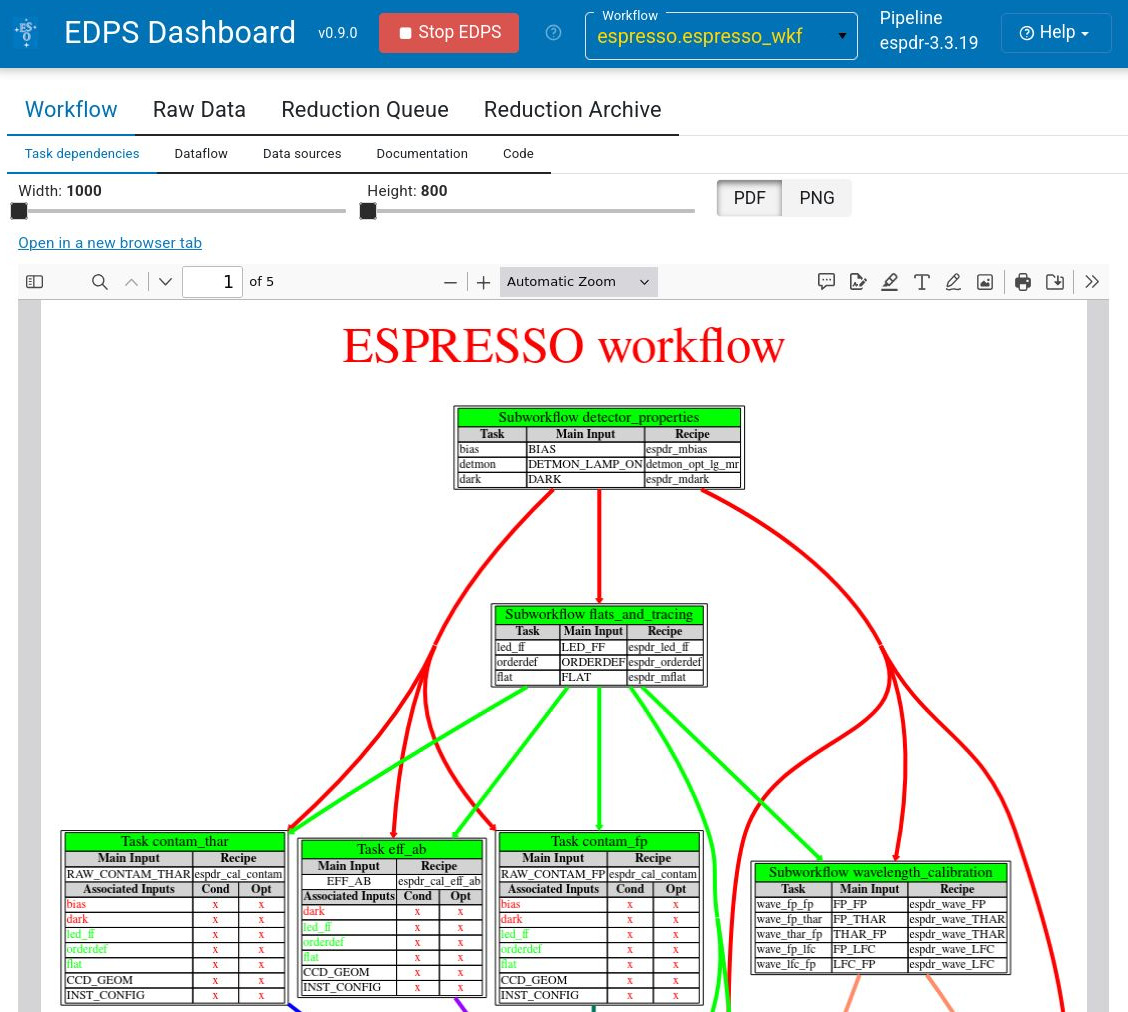
The workflows are located inside the sub-directory three with the ESPRESSO pipeline, e.g.:
...../install/share/esopipes/workflows/espdr-3.3.12/espresso/espresso_wkf.py
It can be inspected, but changes are recommended only for expert users and only after backing up the original workflow file.
The workflows contain the instrument-specific classification and grouping rules, and the cascaded calls to the ESPRESSO pipeline recipes, with the organization of the necessary transfers of files between them.
The ESPRESSO workflow processes individual science observations, generating a separate product for each raw input file. This is not the case for all workflows, because some of them combine multiple input raw files.
The workflow facilitates automation, easy repeatability, and collaboration, which are important for data-intensive projects. This system is flexible – with an appropriate configuration, users can run batch processing on large data sets or process data in flexible mode, repeating one or a few data sets with different parameters, optimizing the data reduction strategy that best suits the users’ science goals.
Go to top
2. Selecting the input data
a. Press Raw Data.
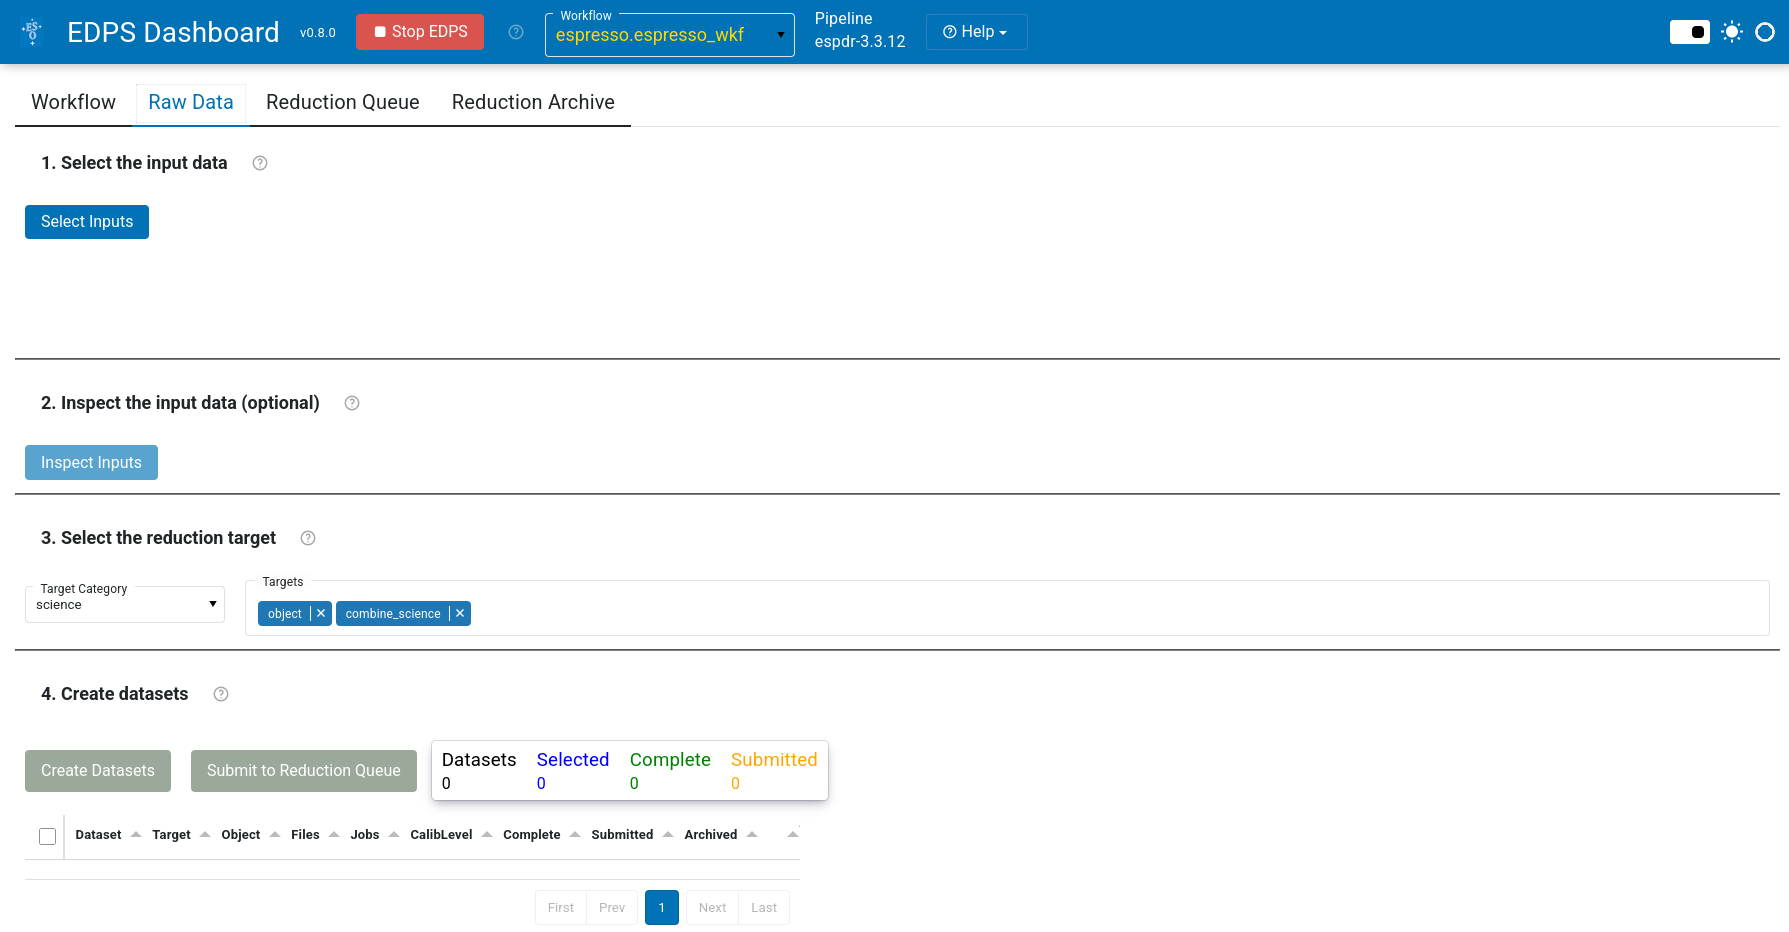
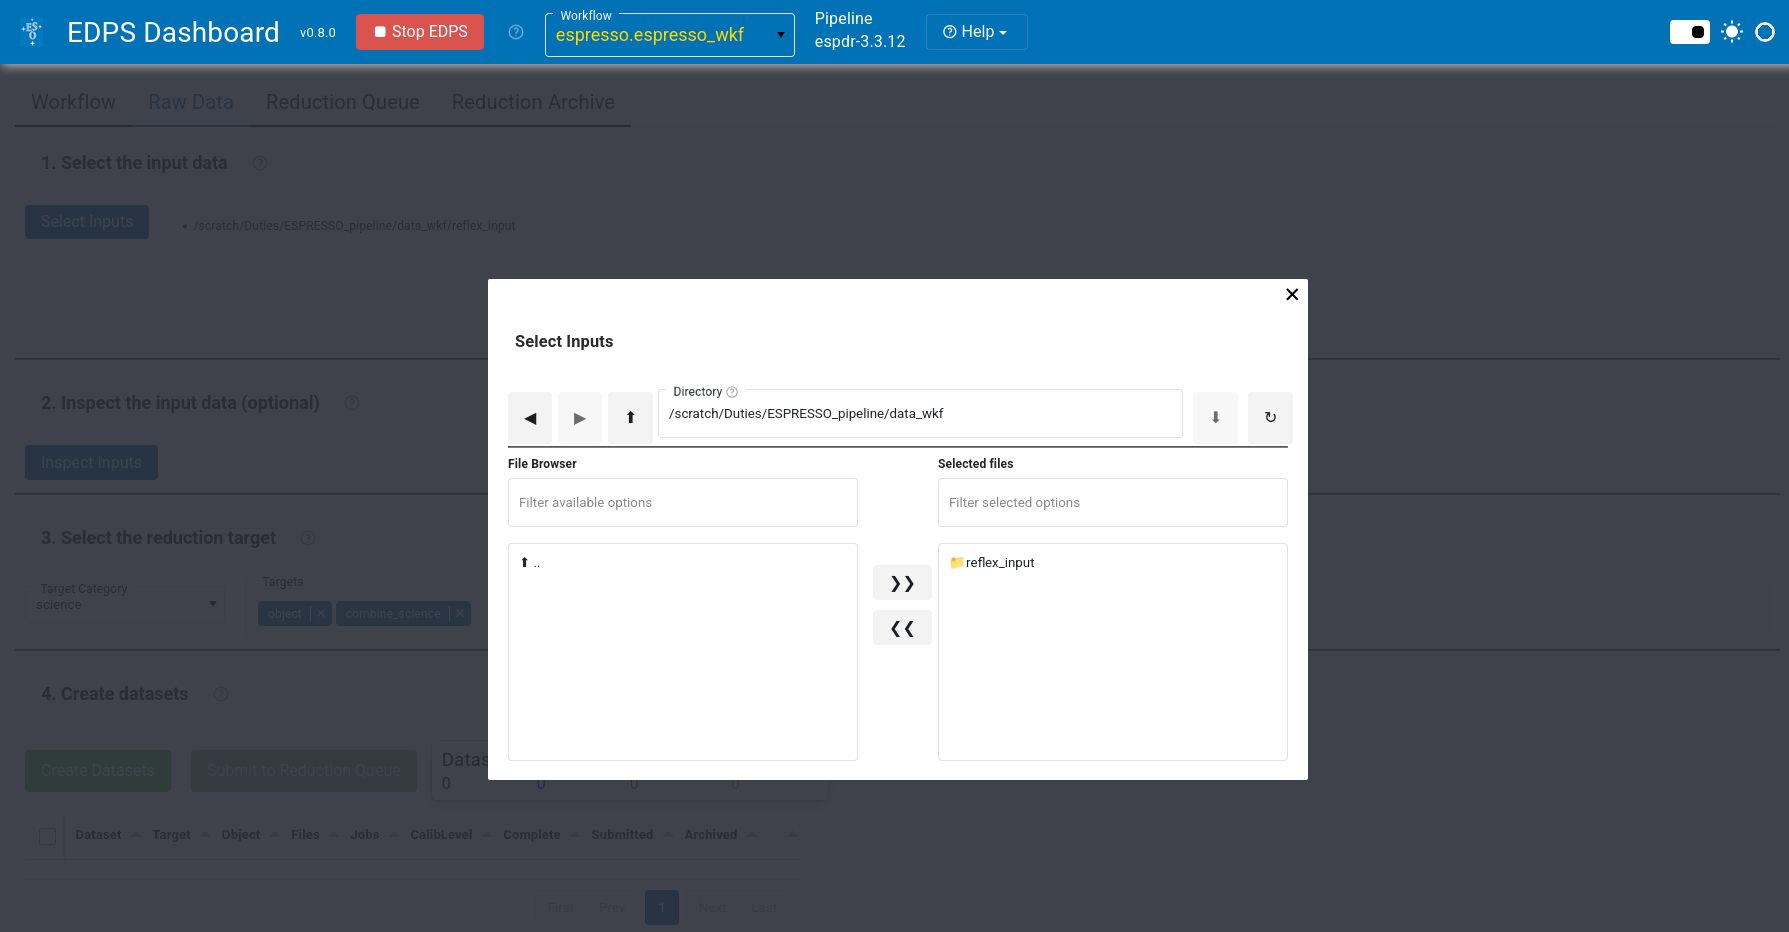
b. Press Select Inputs. A selection window will appear that allows to select data that are stored on a local disk.
c. (Optional). Select the reduction target, configure the workflow parameter and specify the association preferences. These steps are optional. For more information see here.
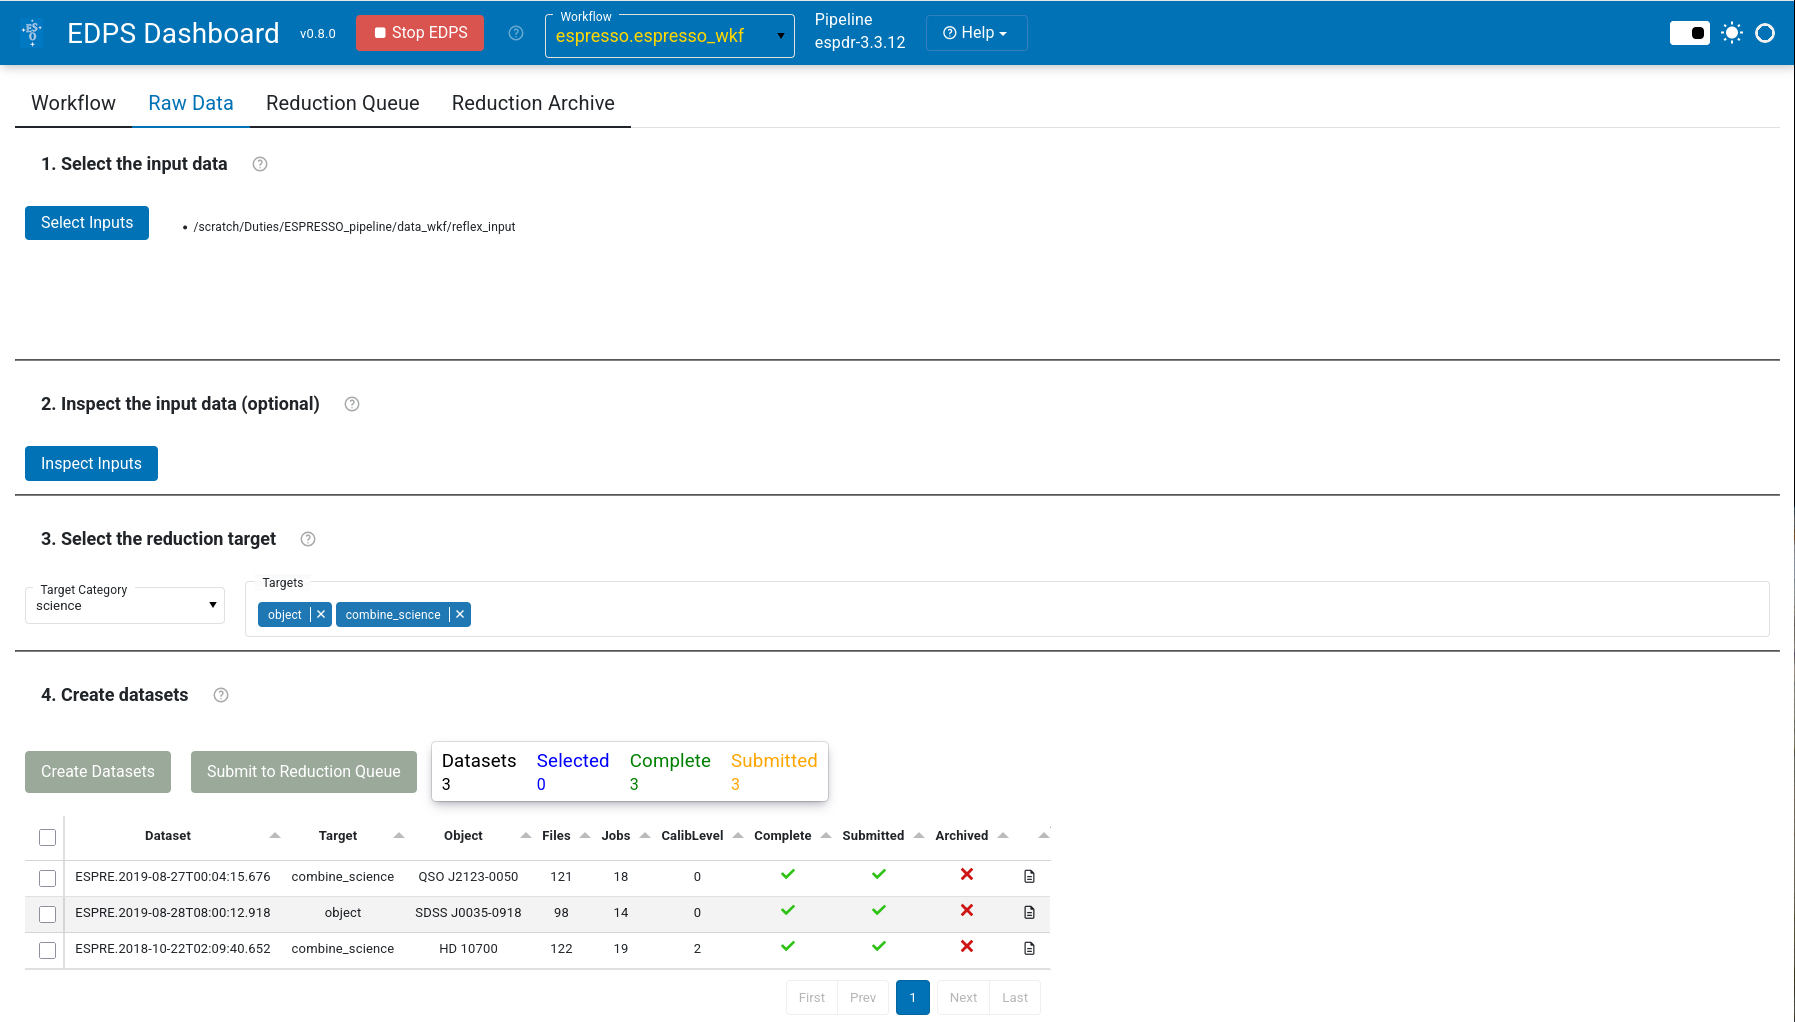
d. Press Create Datasets. A list of datasets appears, one line for each set of science data.
e. Choose the datasets that should be processed
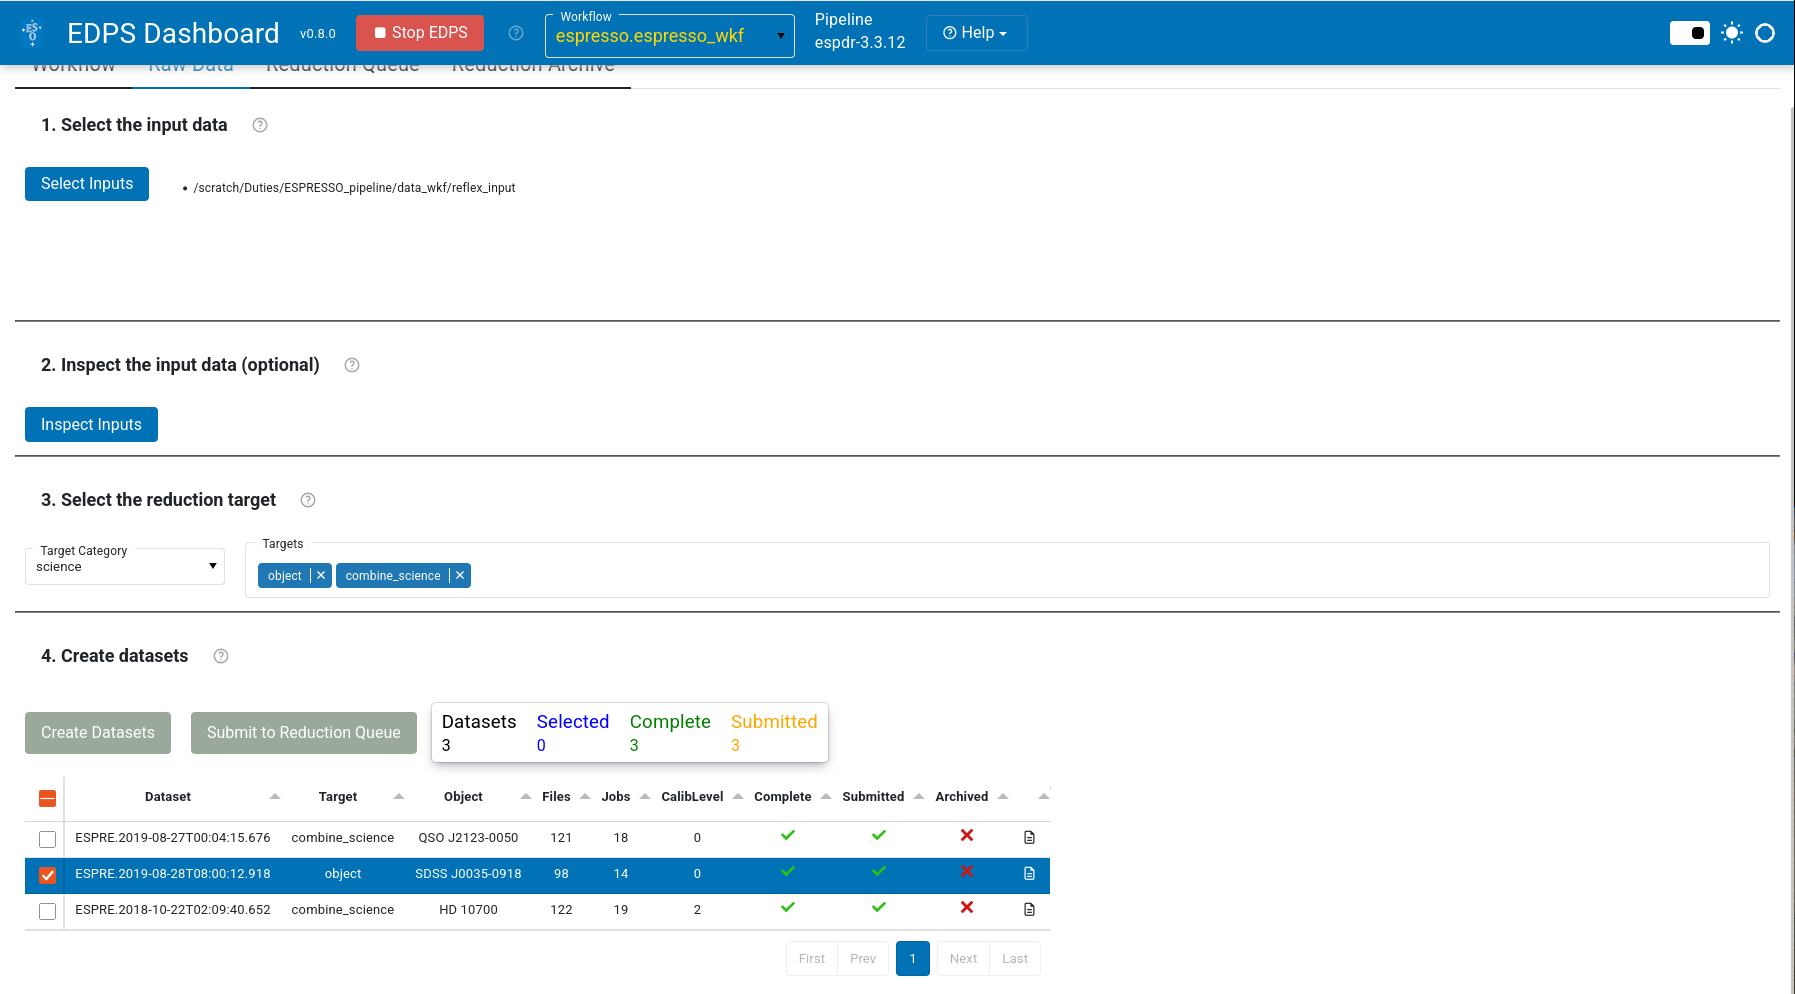
and send them to the data reduction queue by pressing Submit to Reduction Queue. Note that this action does not start the
reduction automatically.
3. Start the reduction
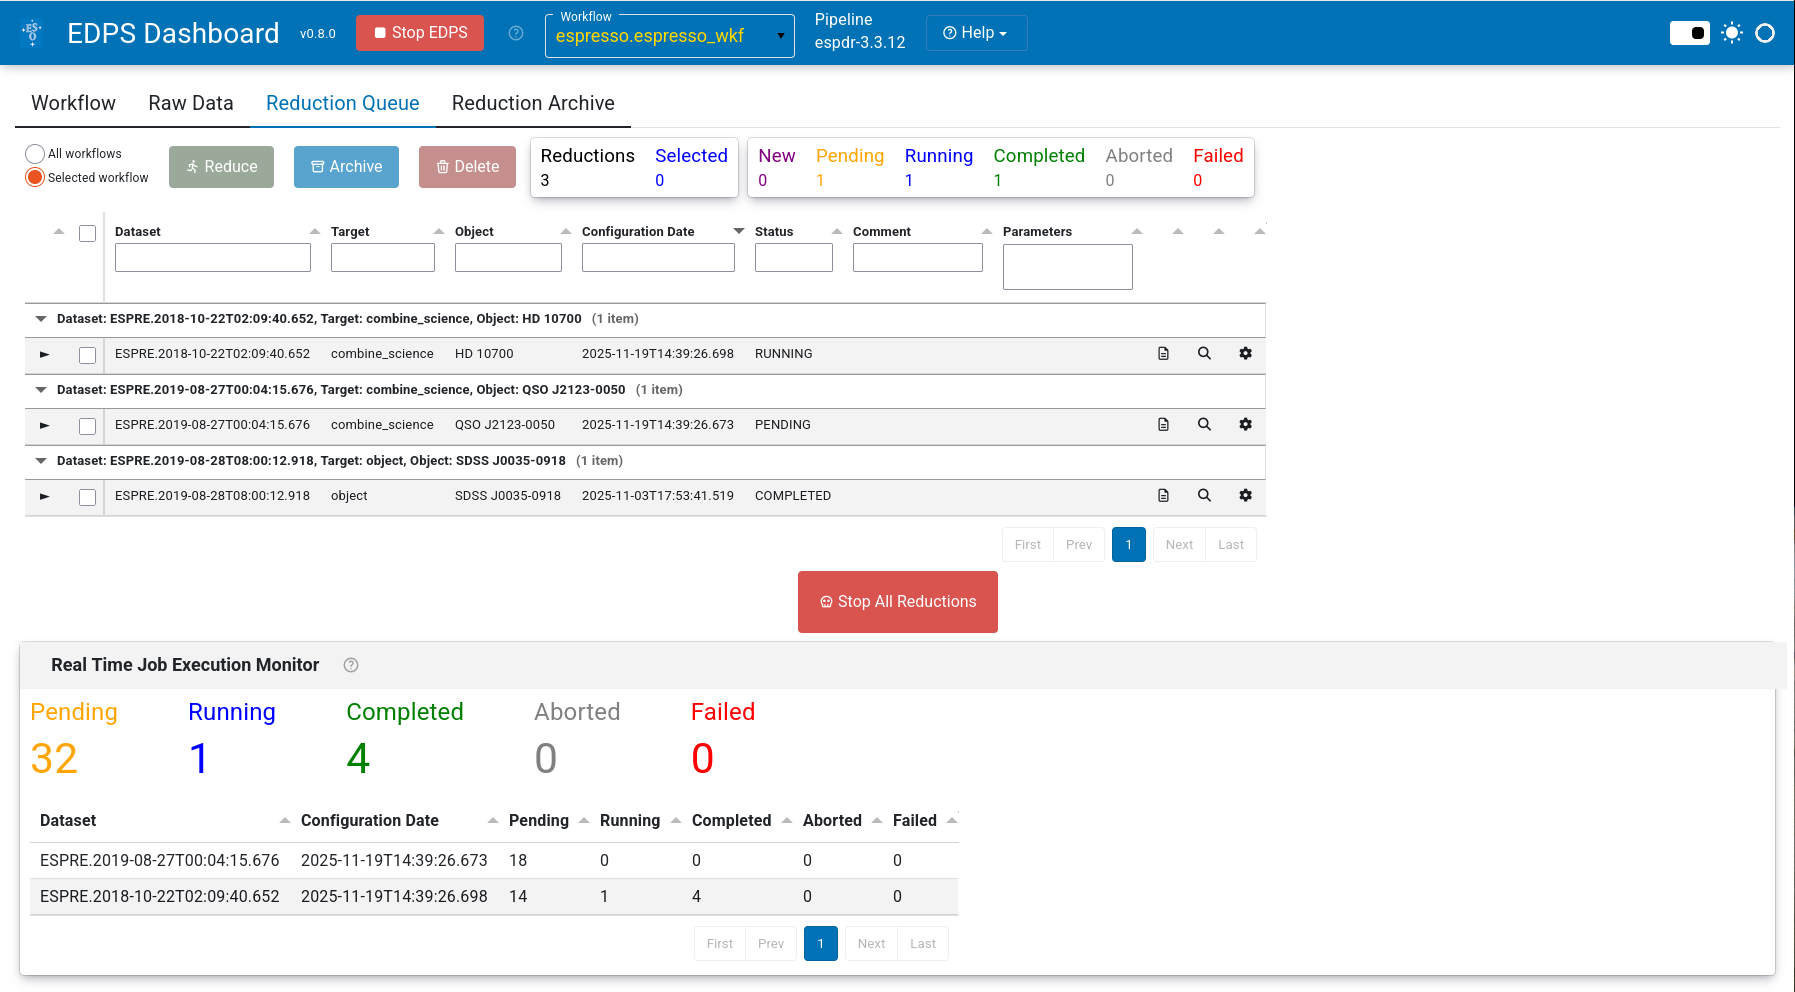
a. Press Reduction Queue.
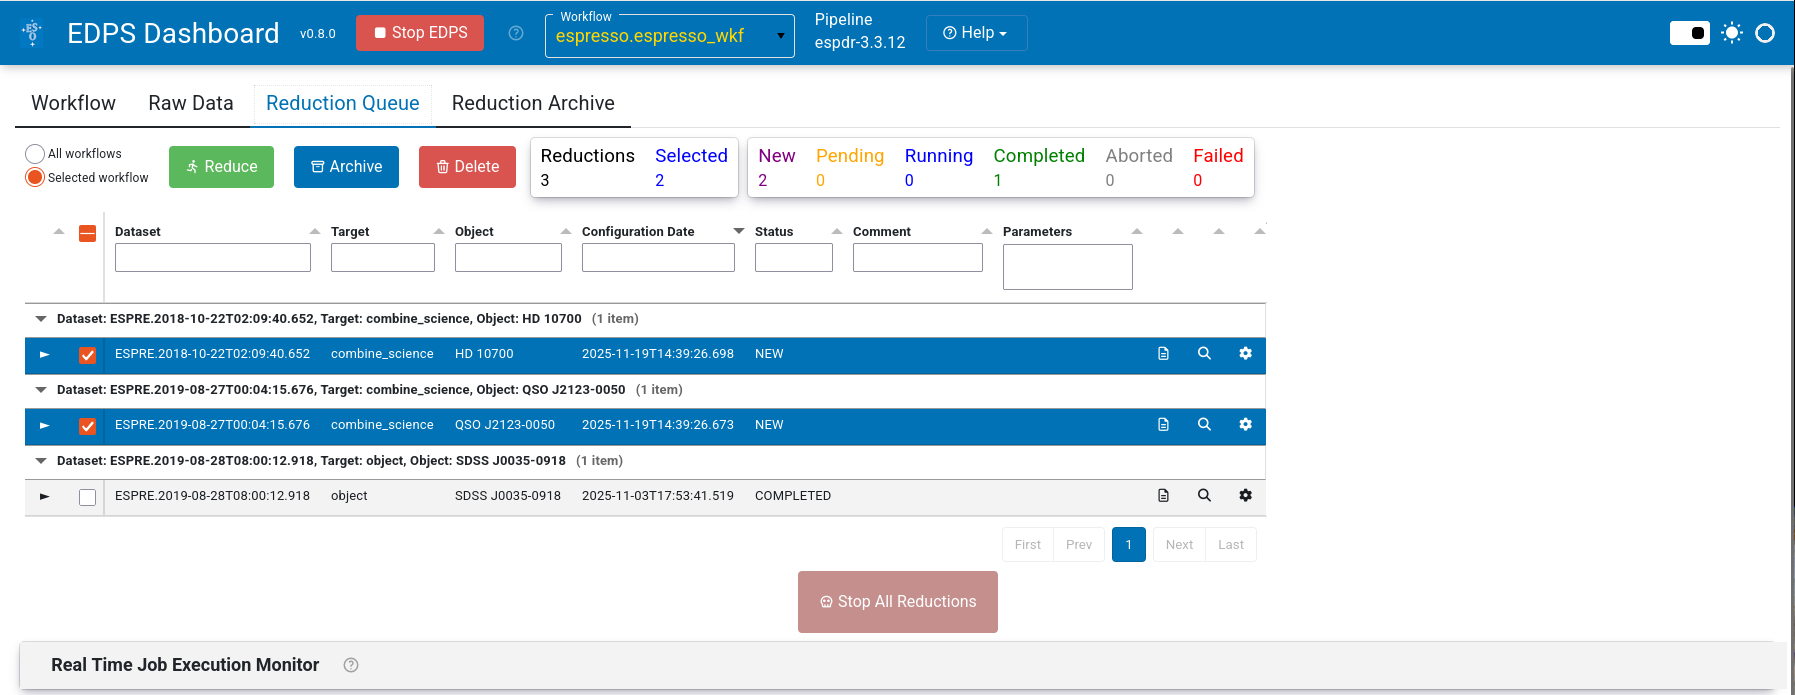
b. (Optional). Configure the workflow and recipe parameters by pressing the wheel
button  to open the configuration editor.
c. Press the Reduce button. The selected data will now be processed with the default parameters.
Congratulations! You reduced your first data with the EDPS dashboard! All the reduced data are saved in the EDPS_data directory specified when executing edps-gui for the first time.
Go to top
4. Final products
Once the workflow is completed successfully, the user can inspect the final ESPRESSO spectra and assess their quality. They are described in detail in the ESPRESSO Pipeline manual (see subsections Output for each recipe in Sec. 9). Some basic information can be found here in Sec. Reducing demo data.
By default, the products are located in a $HOME/EDPS_data
and it contains sub-directories for different instruments,
ESPRESSO in this case. In case the size of the user’s home
directory is limited, the output directory can be changed.
It is defined in $HOME/.edps/application.properties in a
parameter called base_dir. For example:
base_dir=/scratch/EDPS_data
However, it is possible to save only the final products into a desired location. This can be achieved by exporting
archieved data reduction: press the Export button in the Archieved Data tab
(see here, or consult the Frequently Asked Questions ).
To archieve a data reduction, press the button Archive in the Reduction Queue tab.
Products are organized by DATASET (named as the first scientific exposure of the dataset), and TIMESTAMP (time of
start of reduction)
The final products saved in the specified directory are:
Final spectrum, obtained by combining several science exposures (if the combination task was performed). Its name is
SPECTRUM_COMBINED_followed by the target name (as obtained from the header keywordOBS TARG NAMEof the first exposure)Individual extracted spectra. Their name are SPECTRUM_ followed by the exposure identifier (header keyword
arcfile). They are stored in the subdirectoryindividual_exposures.
Go to top
5. Quality plots
Almost all processing tasks can display the input raw frames and the products in the so called “quality plots”, which
can be inspected from the Reduction Queue window.
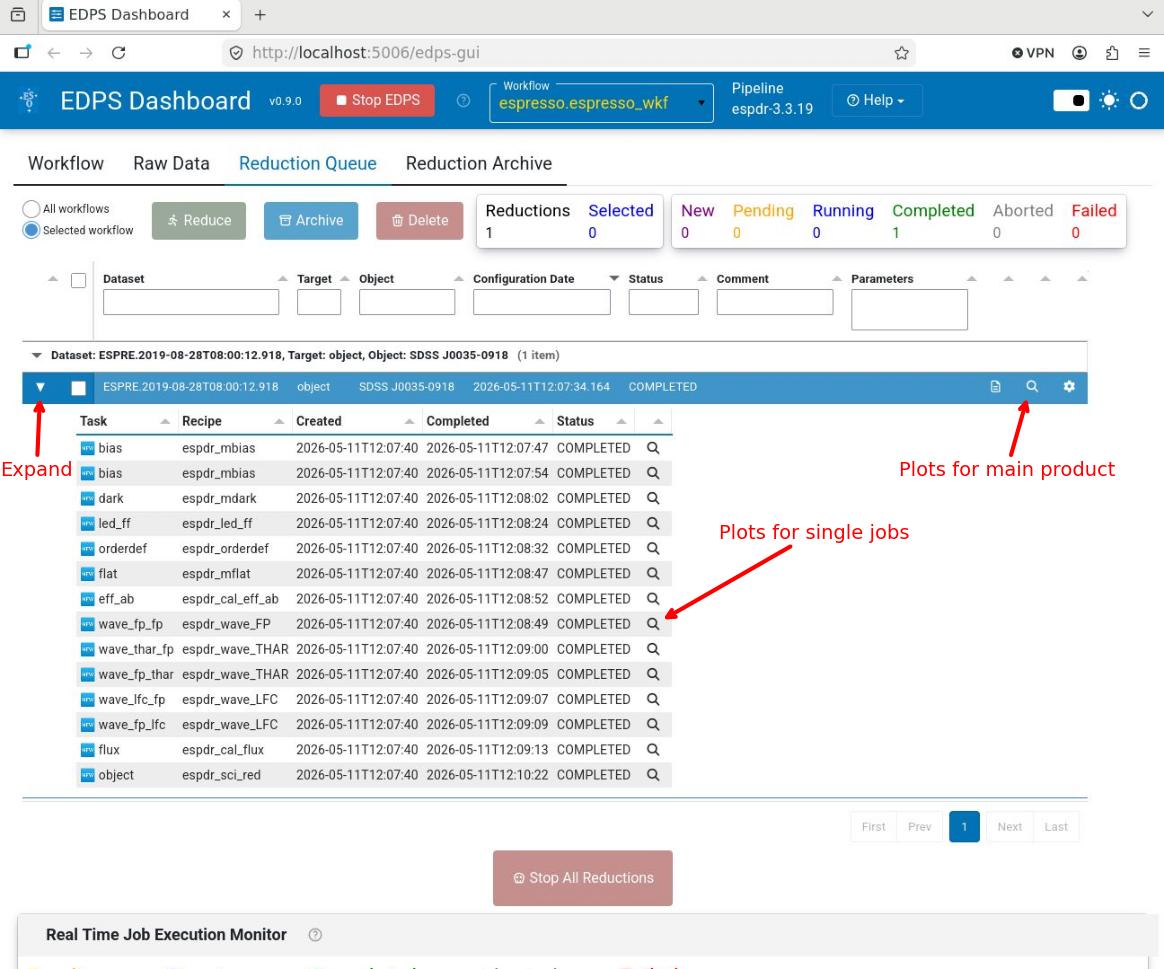
Those associated for the main product can be inspected by pressing the magnifying glass symbol at the right side of each dataset.
To inspect those associated to each individual job (if created),
Expand the desired dataset by pressing the black arrow on its left. The list of jobs will appear with the associated status (COMPLETED, RUNNING, PENDING)
Press the magnifying glass symbol at the right side of the job you want to inspect. Only plots for completed jobs can be inspected.
Go to top
Go to ESPRESSO EDPS tutorial index