Reducing demo data
Follow this procedure to quickly reduce SPHERE-IRDIS demo data. We assume that the EDPS Graphic User Interface, the SPHERE-IRDIS
pipeline and the demo data are installed in your system. For general instructions on how to install EDPS and the
pipeline, please
visit https://www.eso.org/sci/software/pipe_aem_main.html.
1. Setting the workflow
a. After installation and while still in the installation virtual environment (if not, activate it again), start the EDPS dashboard by typing:
edps-gui
The EDPS dashboard will start in a browser window.
b. Optionally, before starting EDPS, one can specify new settings by pressing Help –> Settings (see here)

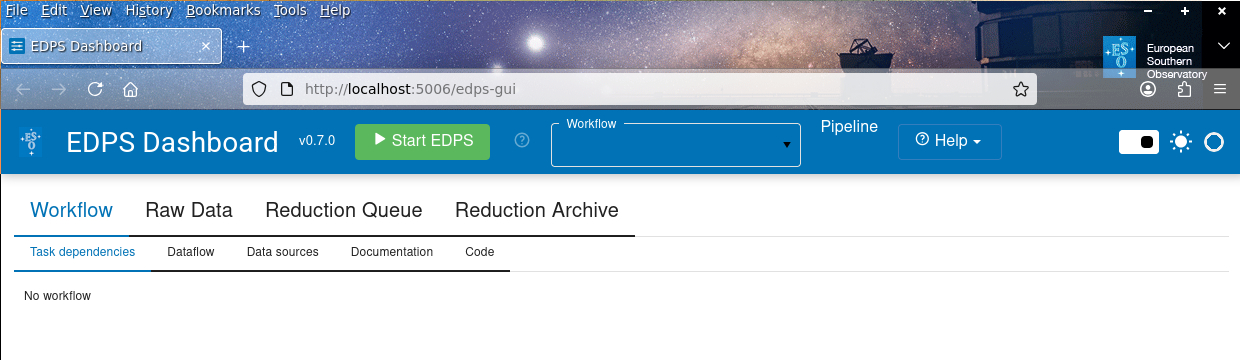
c. On the browser window with the EDPS dashboard, press the button Start EDPS.

d. Choose the SPHERE-IRDIS pipeline from the list in the workflows field. The workflows offered in this selector depend on
the installed pipelines.
The graphic workflow representation will appear as in Fig. 3.

Fig. 3 The EDPS Dashboard (Graphic User Interface) with the SPHERE-IRDIS workflow loaded.
2. Selecting the input data
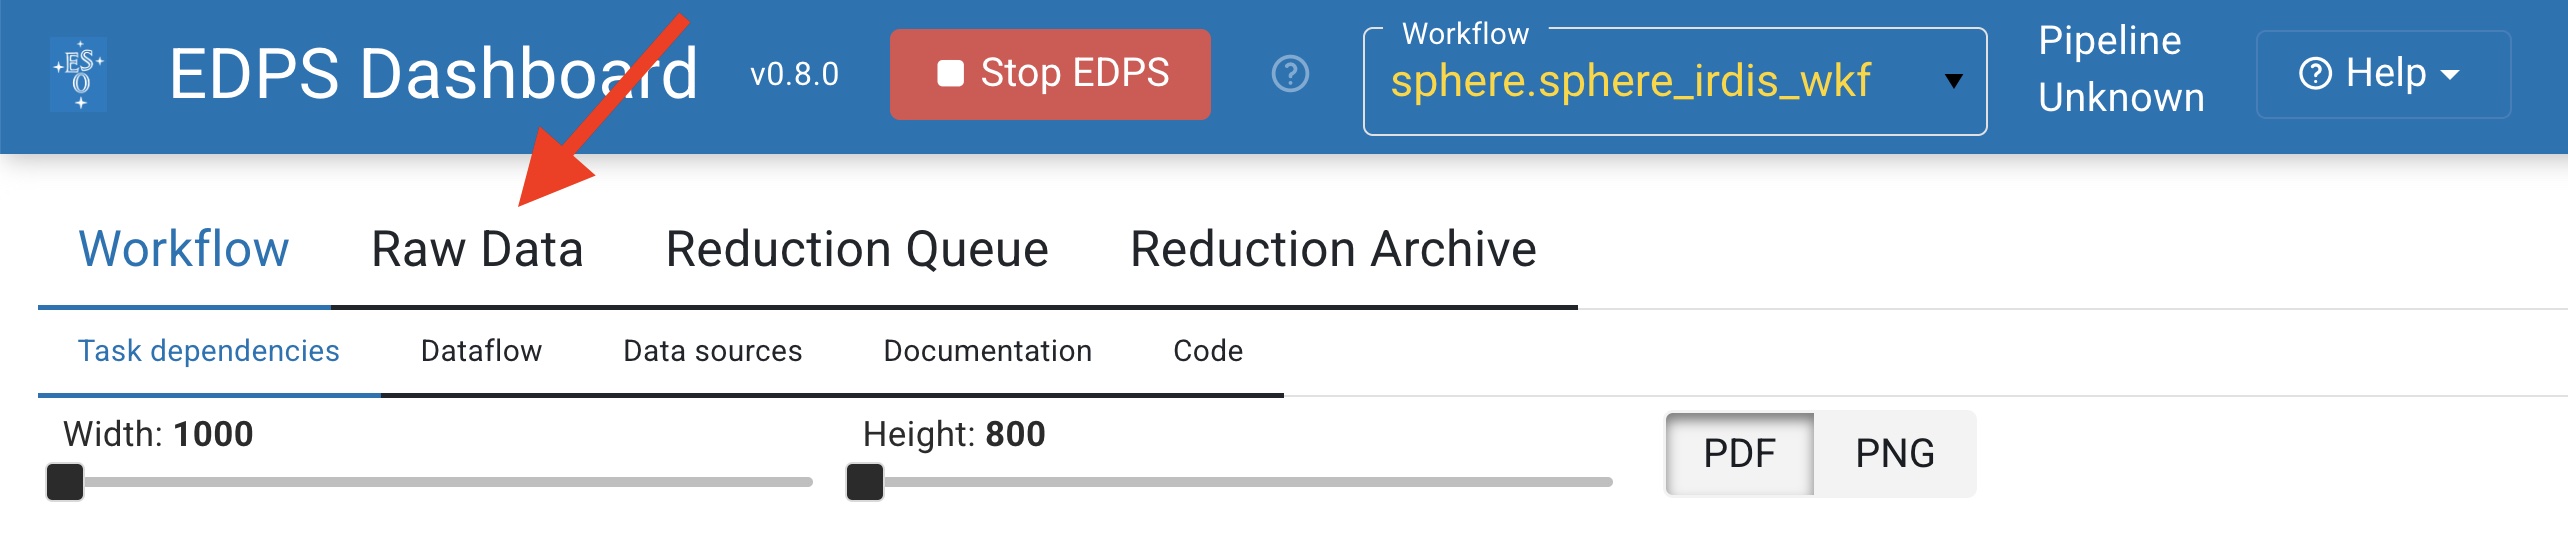
a. Press Raw Data.
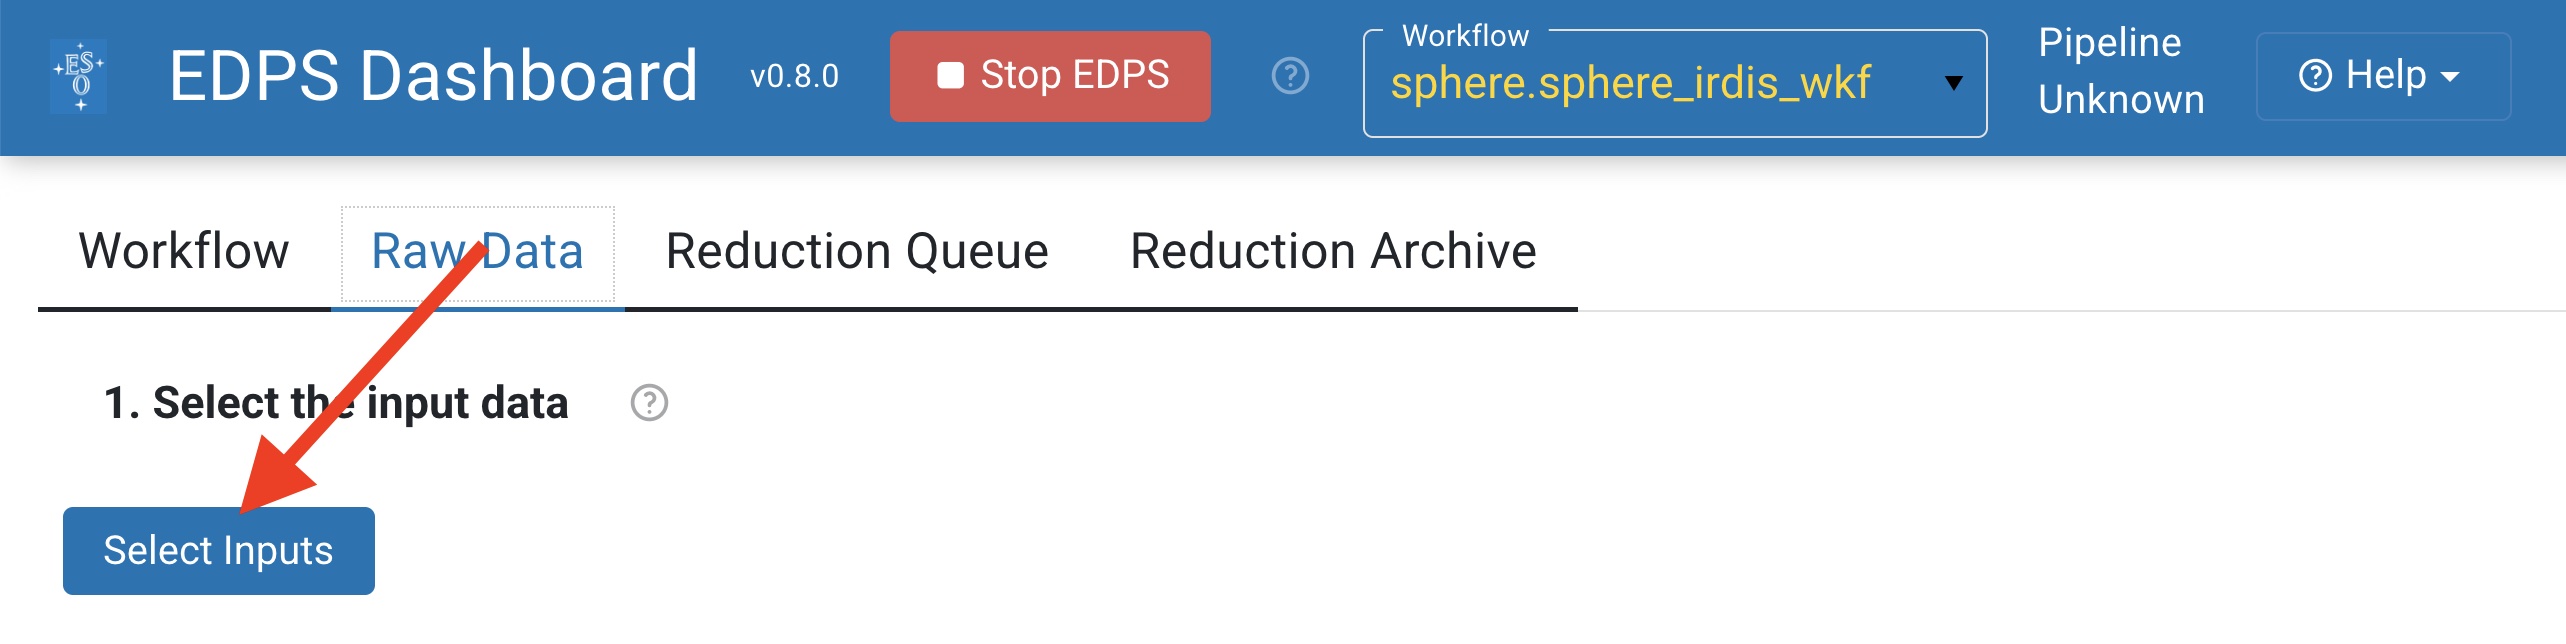
b. Press Select Inputs. A selection window will appear that allows to select data that are stored on a local disk.
c. (Optional). Select the reduction target, configure the workflow parameter and specify the association preferences. These steps are optional. For more information see here.
d. Press Create Datasets. A list of datasets appears, one line for each set of science data.
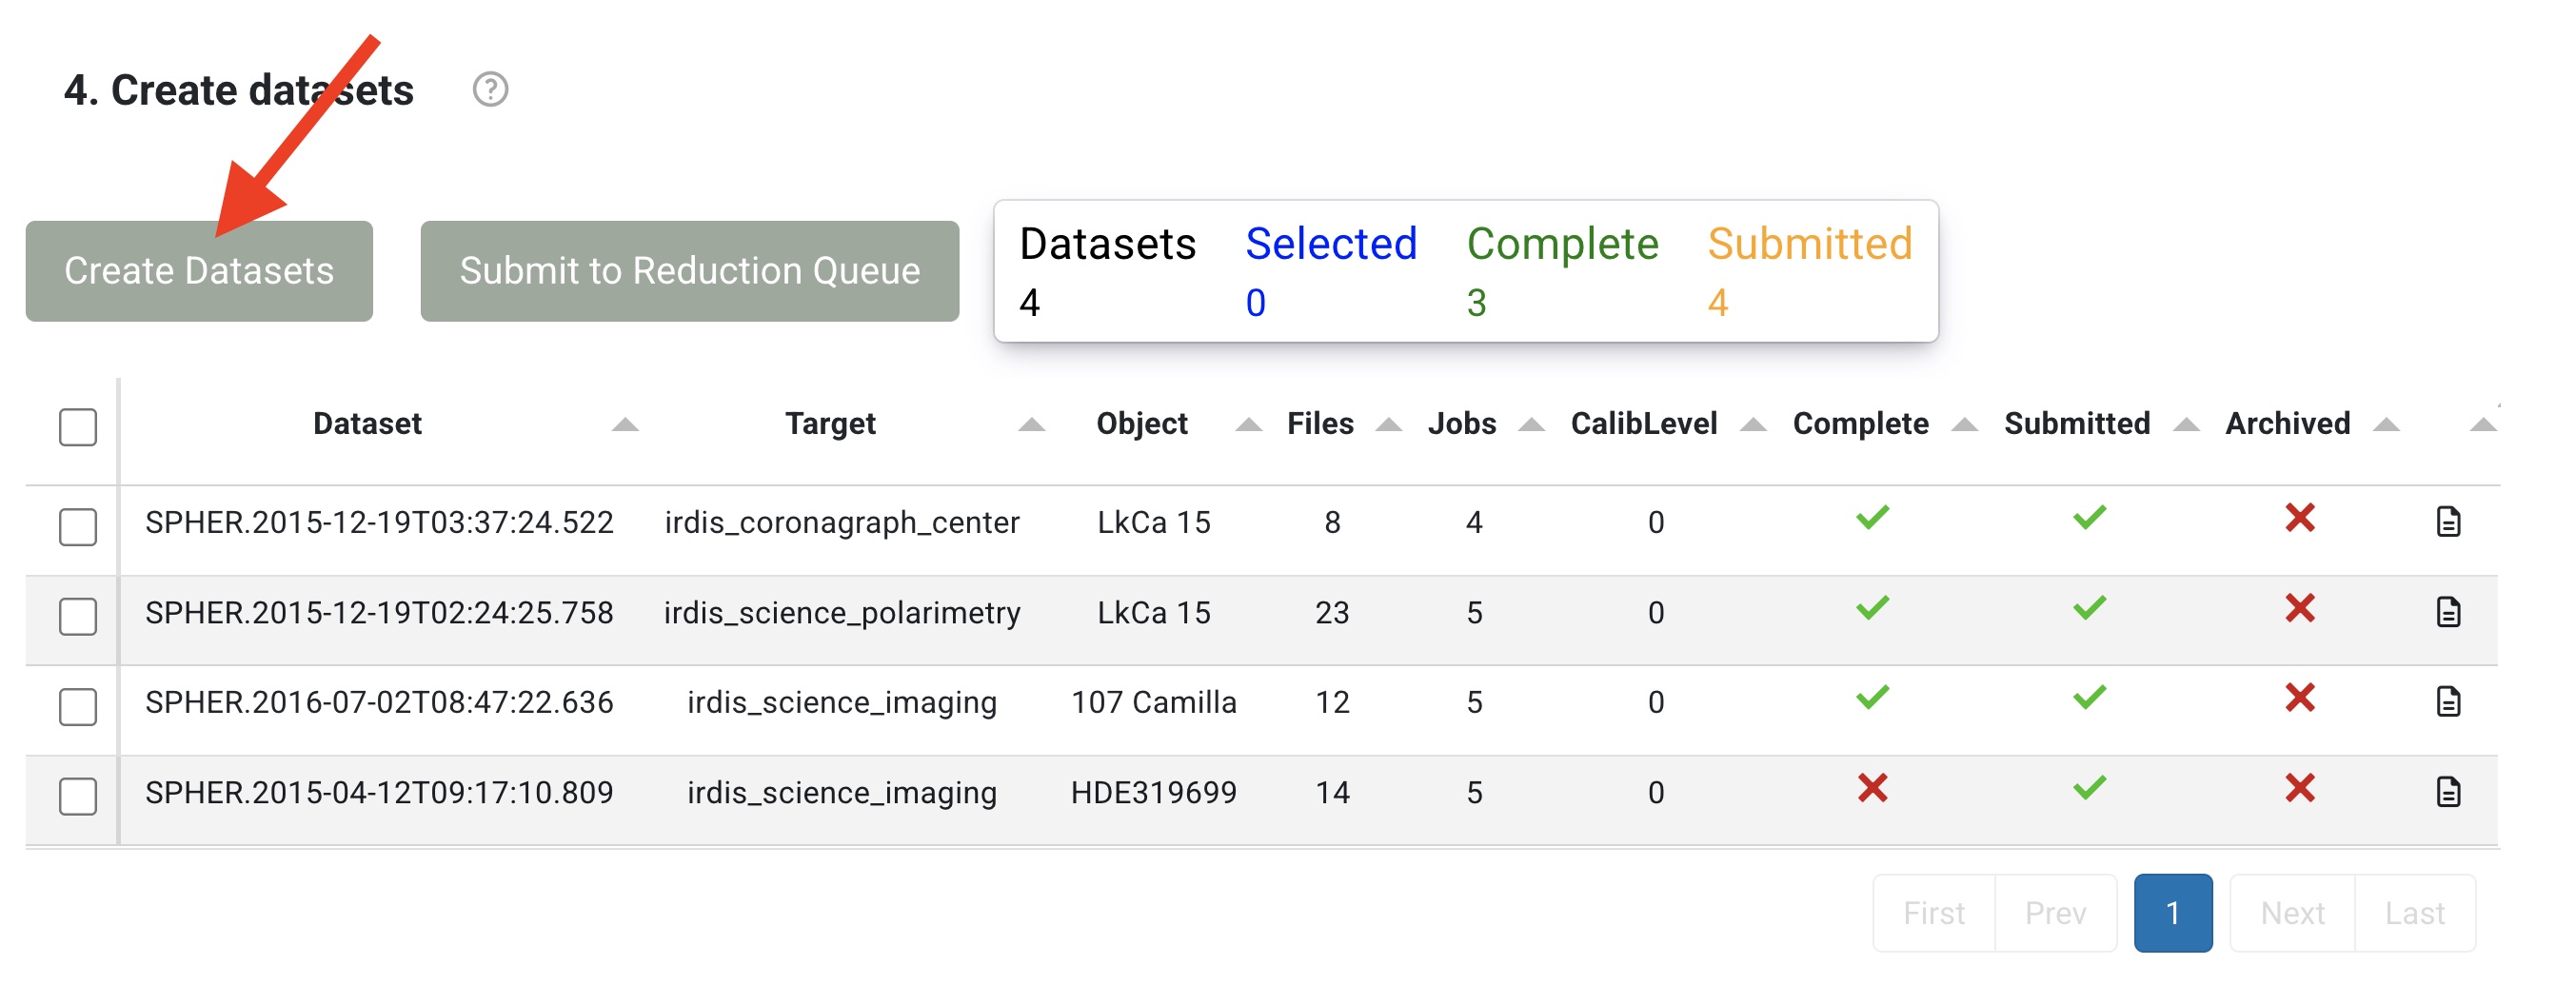
e. Choose the datasets that should be processed
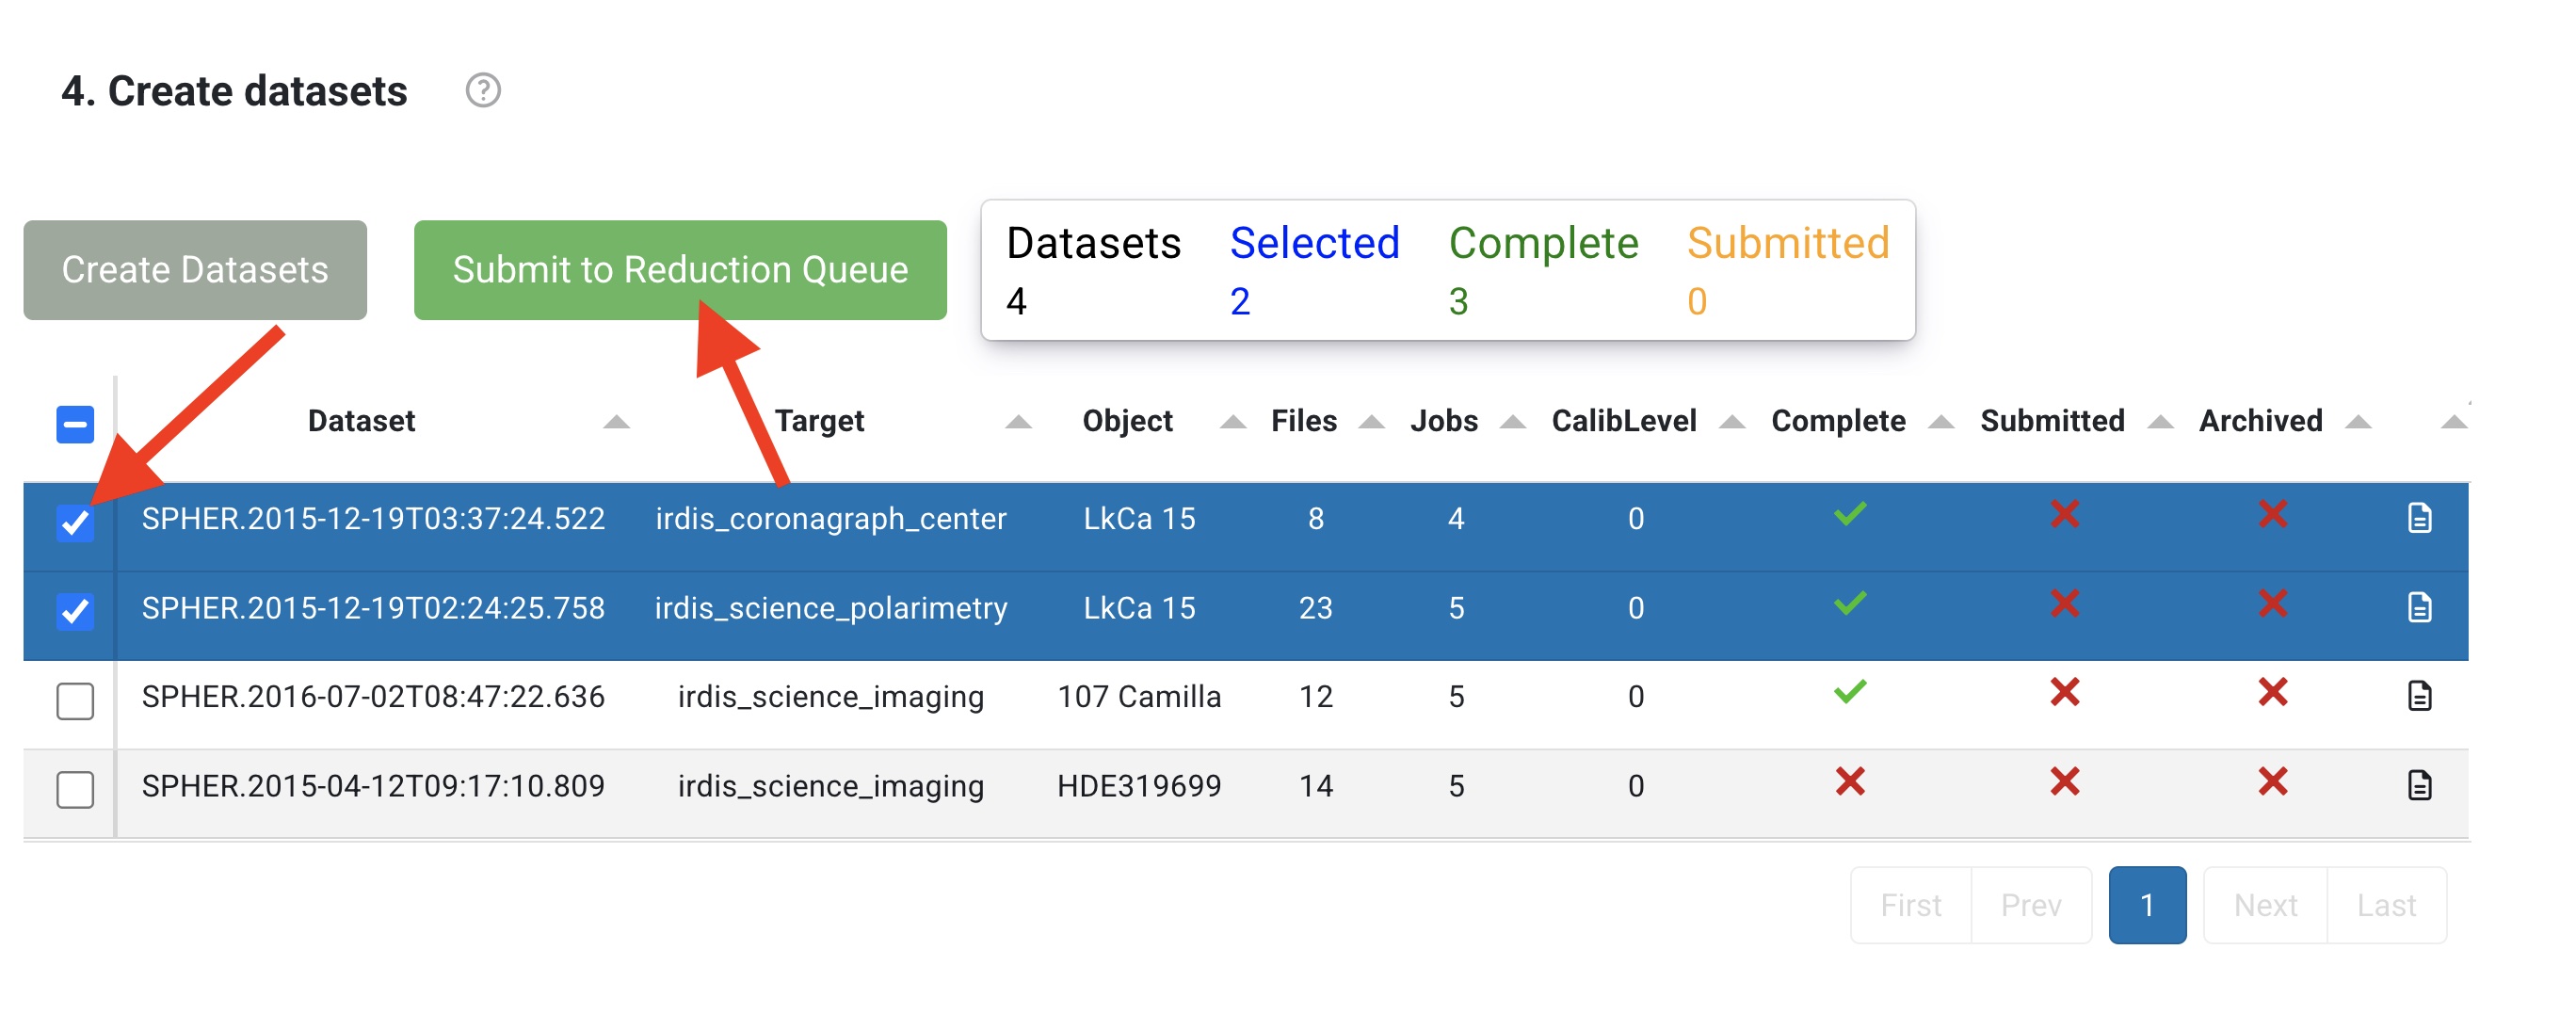
and send them to the data reduction queue by pressing Submit to Reduction Queue. Note that this action does not start the
reduction automatically.
3. Start the reduction
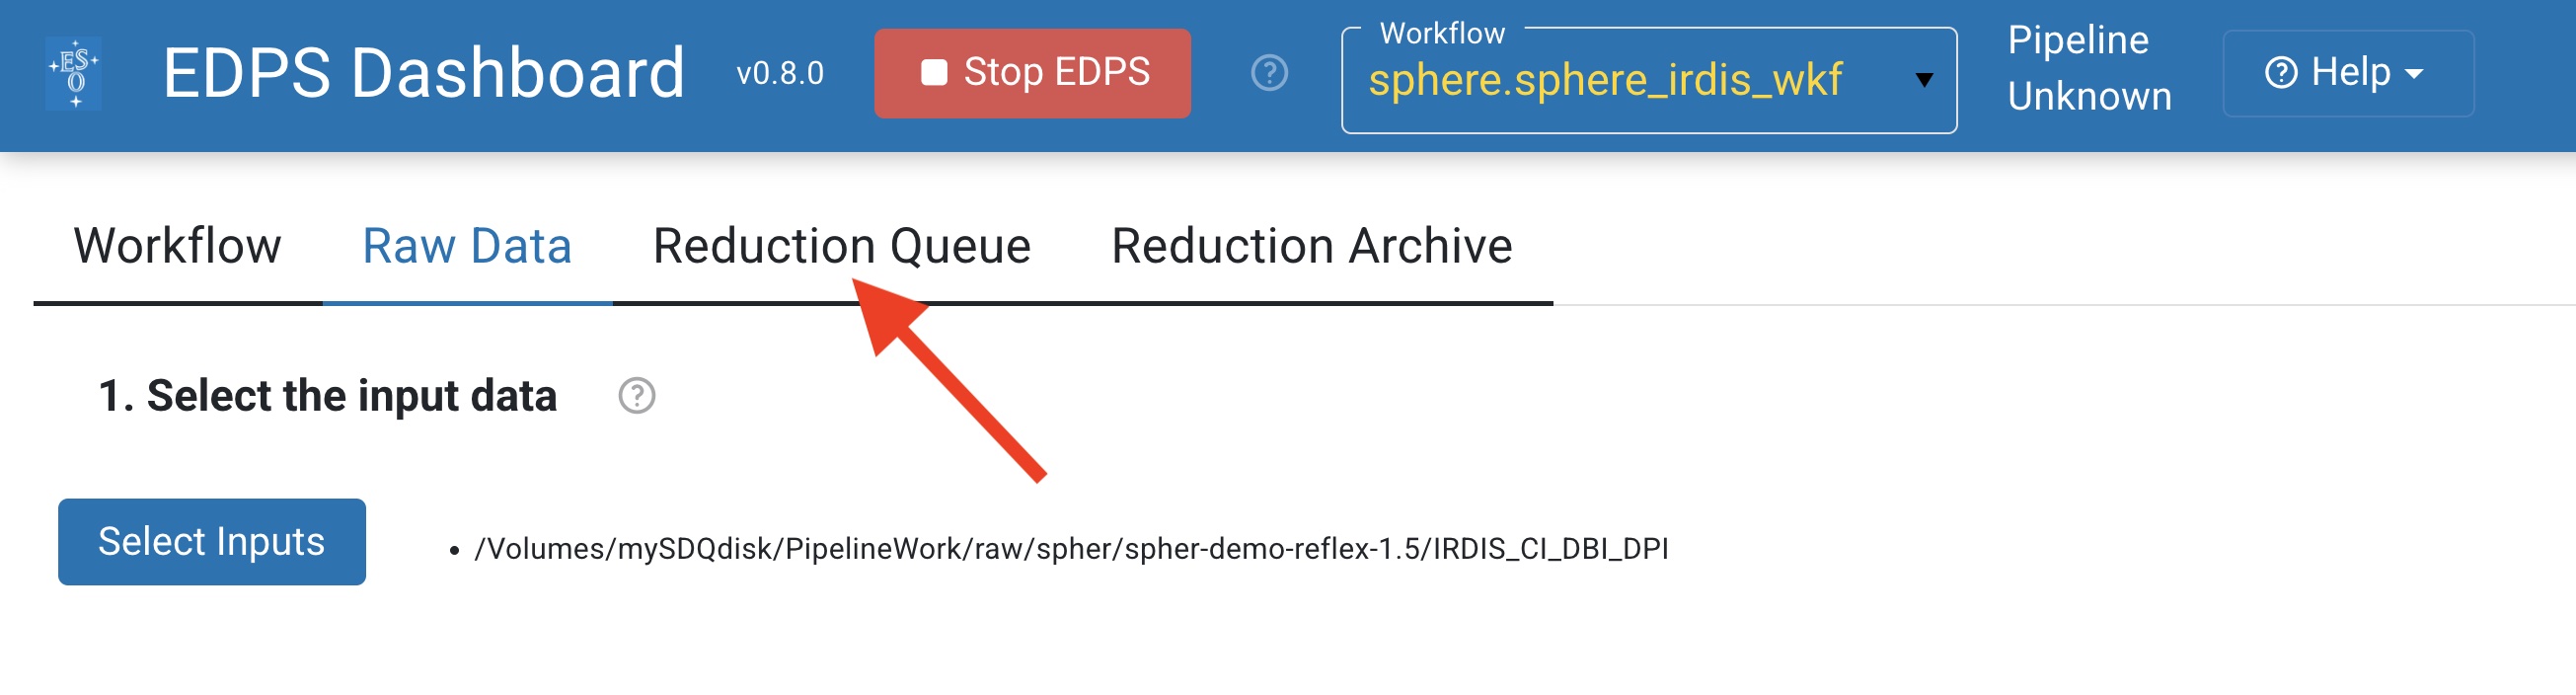
a. Press Reduction Queue.
b. (Optional). Configure the workflow and recipe parameters by pressing the wheel
button  to open the configuration editor.
c. Press the Reduce button. The selected data will now be processed with the default parameters.
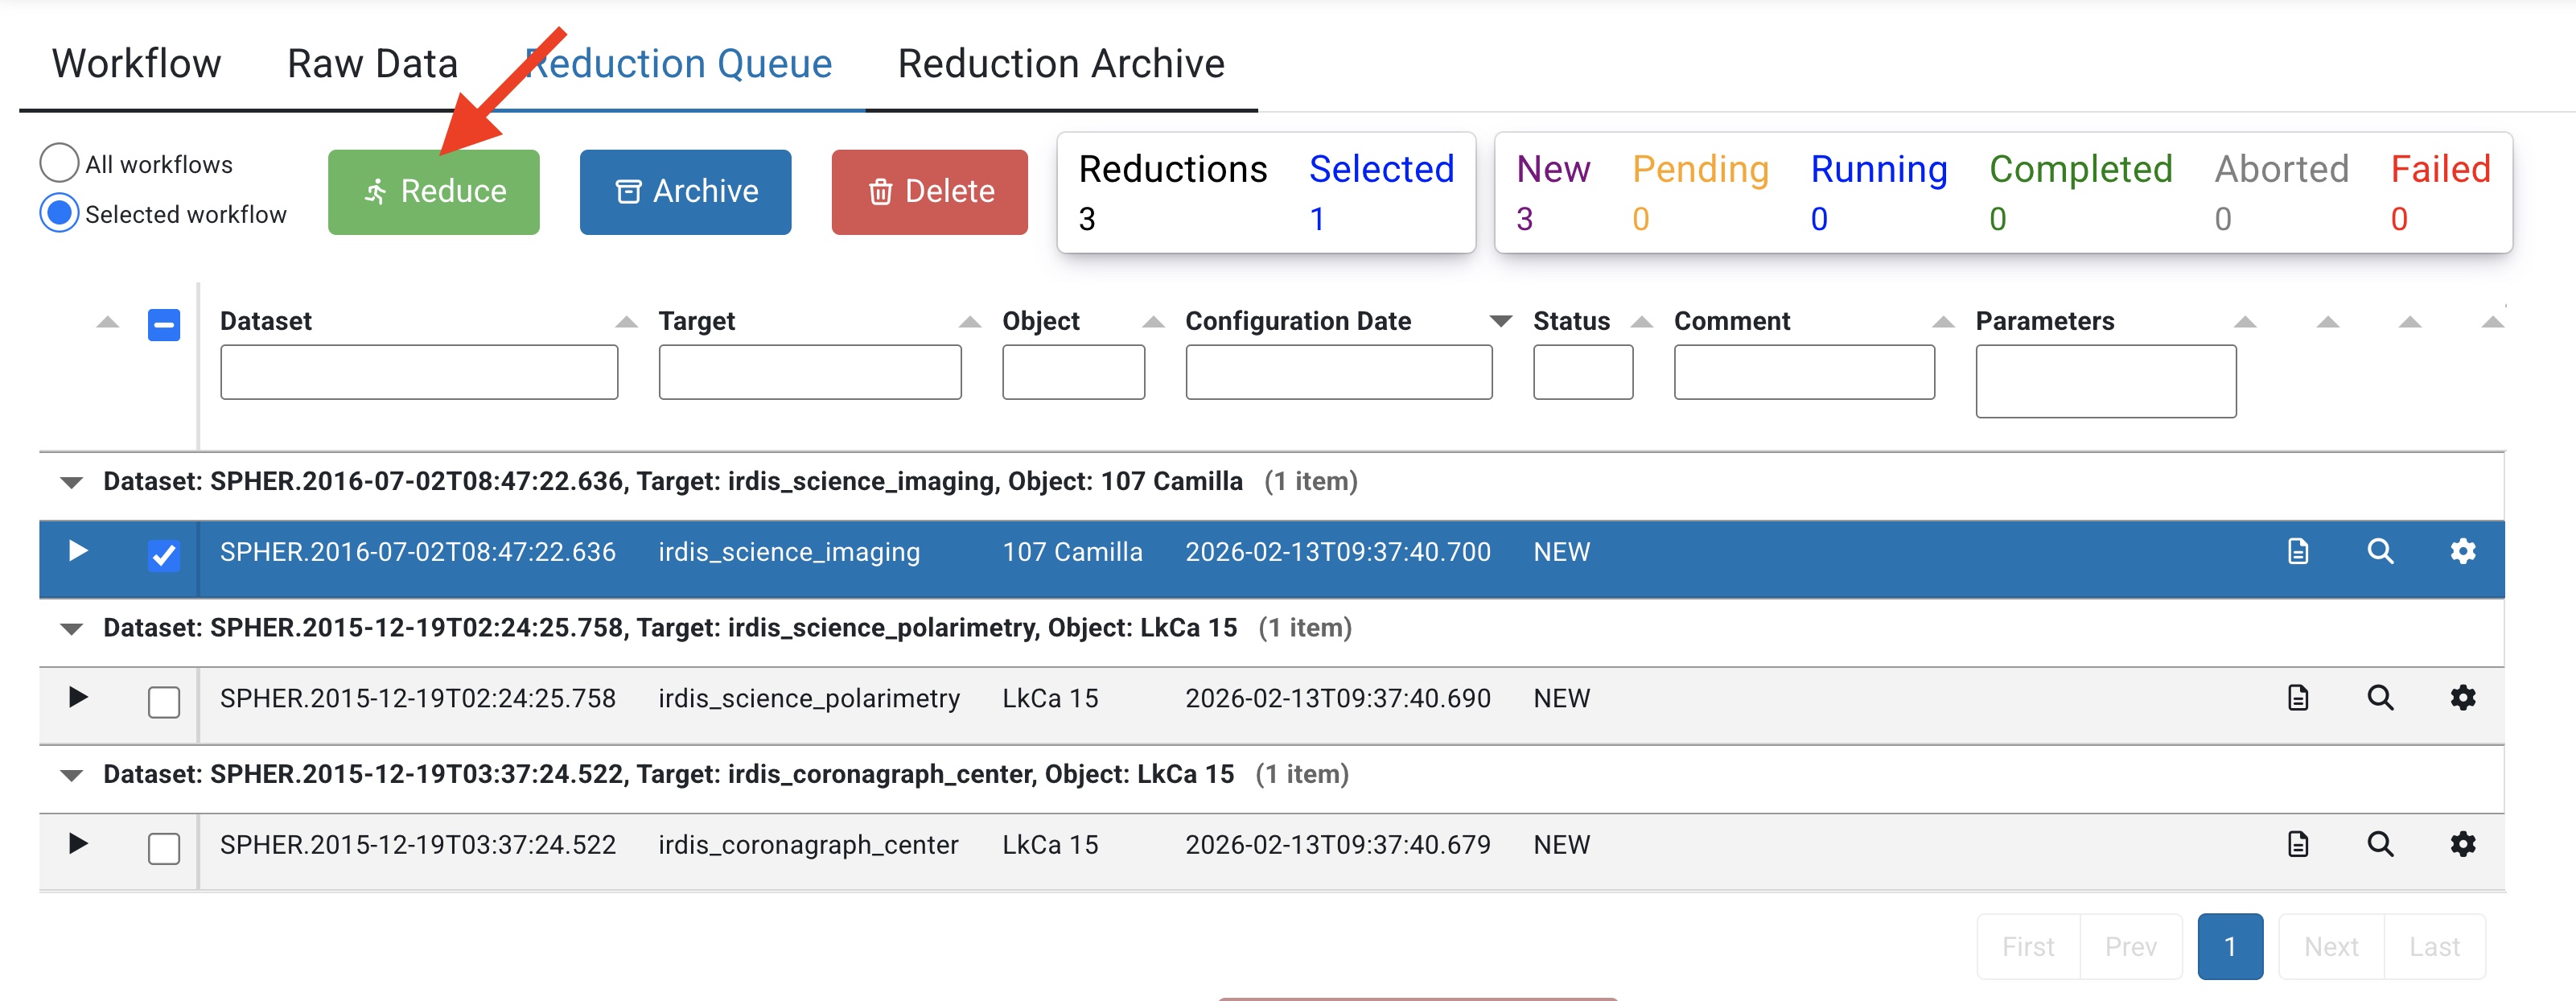
Congratulations! You reduced your first data with the EDPS dashboard! All the reduced data are saved in the EDPS_data directory specified when executing edps-gui for the first time.
4. Final products
By default, EDPS saves all the recipe products for all the executions in the directory specified at the first execution (default: $HOME/EDPS_data).
However, it is possible to save only the final products into a desired location. This can be achieved by exporting
archived data reduction: press the Export button in the Archived Data tab
(see here).
To archive a data reduction, press
the button Archive in the Reduction Queue tab (see here).
The exported products are organized by DATASET (named as the first scientific exposure of the dataset), and TIMESTAMP (time of
start of reduction).
The final product saved in the specified directory is the wavelength-calibrated datacube, with name format
IRDIS_ followed by the observing mode (e.g., IMAGE_, POLARIMETRY_, STAR_CENTER_),
and archive file name (corresponding to header keyword ARCFILE).
Other useful products can be found in the EDPS_data directory, where all intermediate products are saved.
5. Quality plots
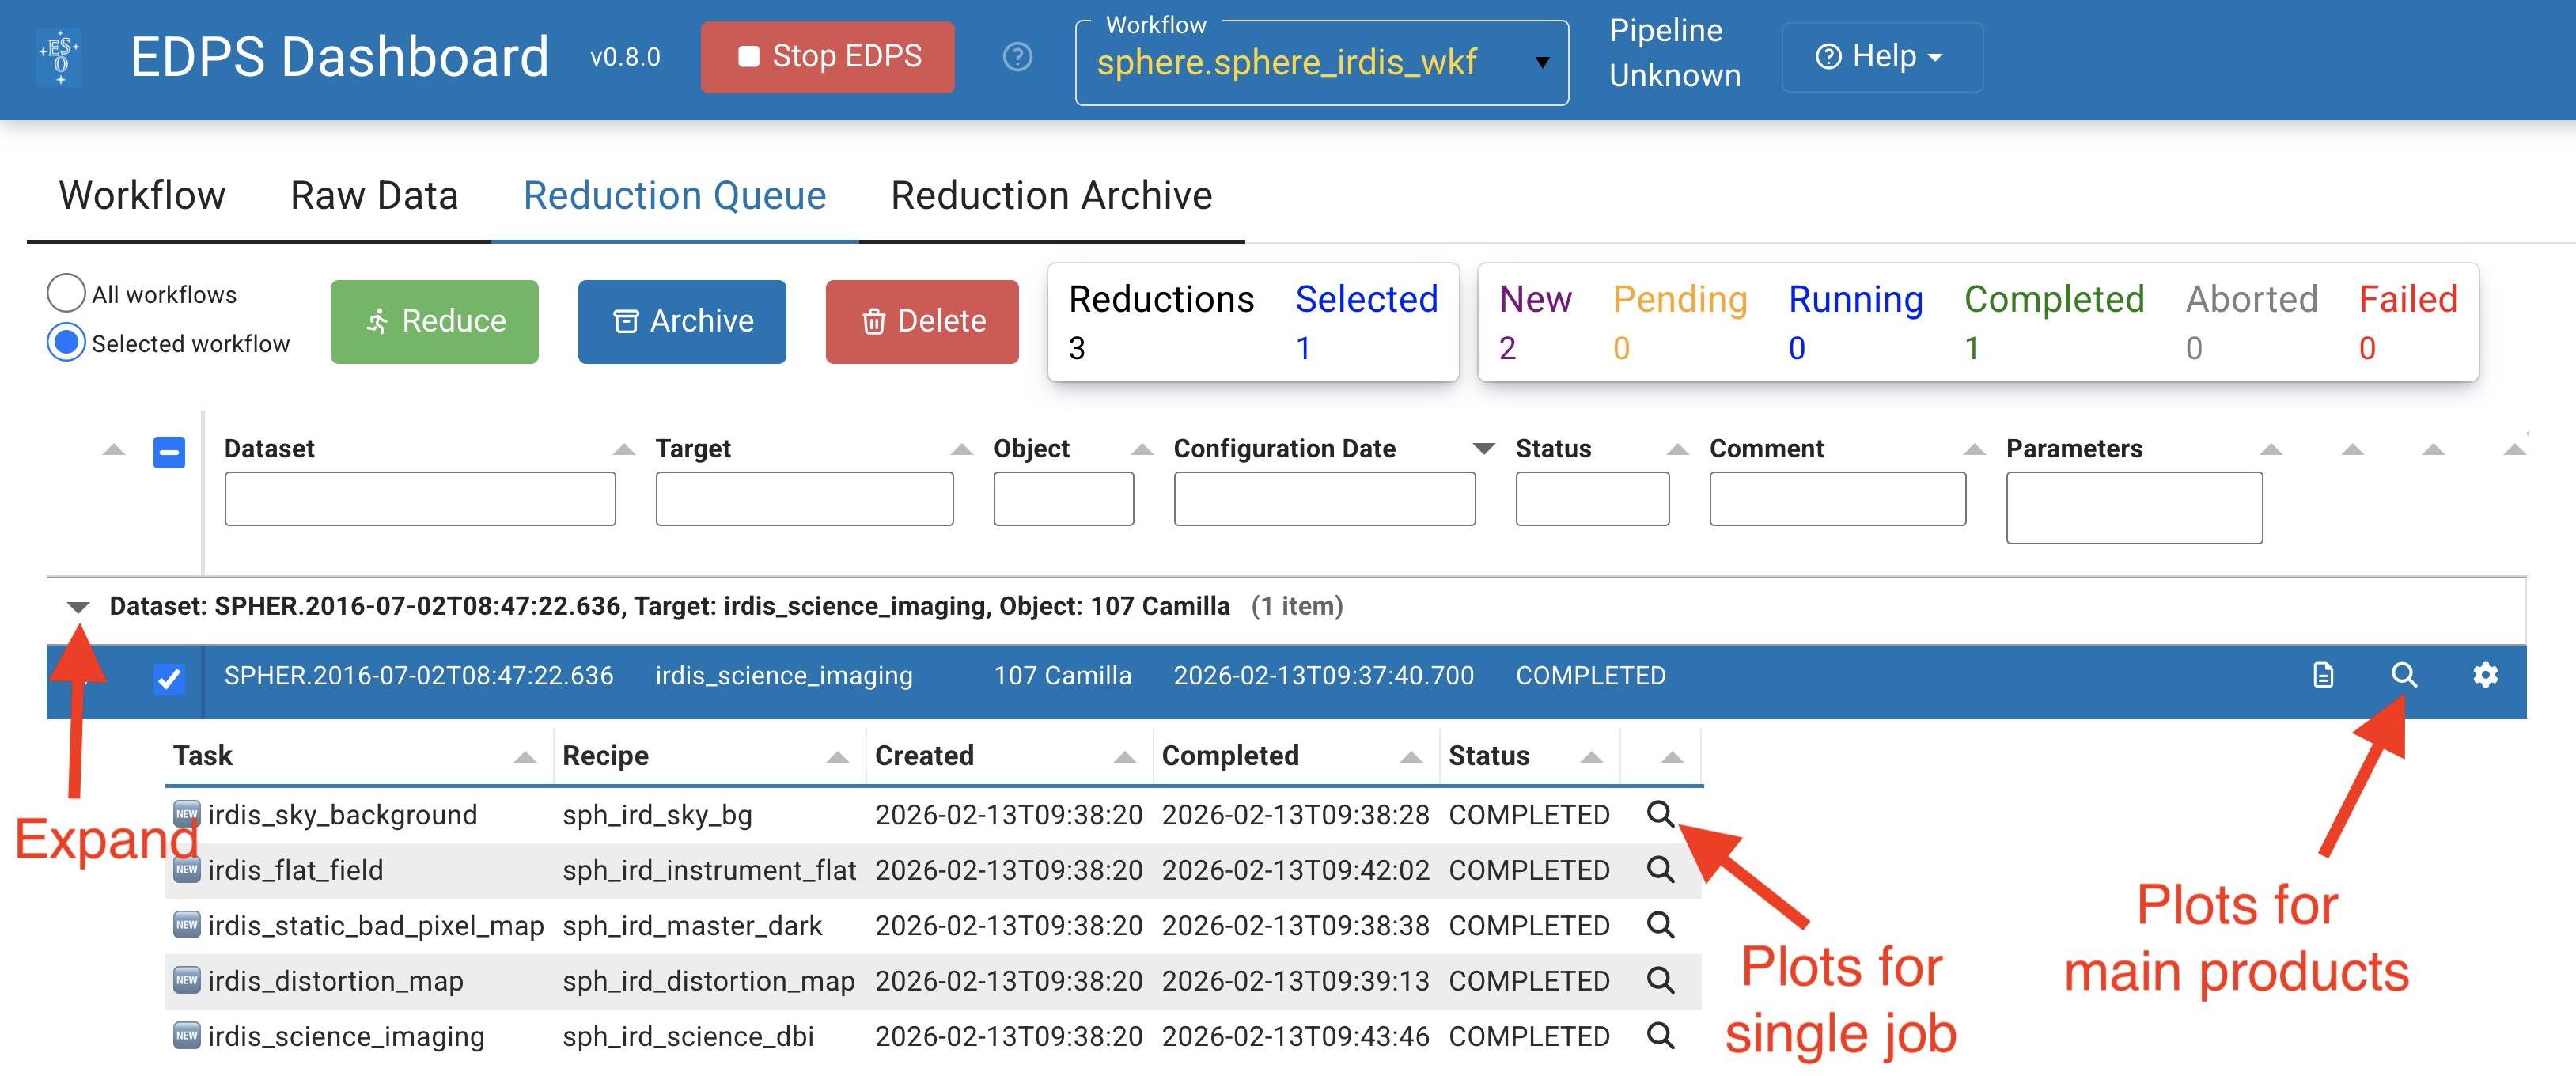
Almost all processing tasks can display the input raw frames and the products in the so called “quality plots”, which
can be inspected from the Reduction Queue window.
Those associated for the main product can be inspected by pressing the magnifying glass symbol at the right side of each dataset.
To inspect those associated to each individual job (if created),
Expand the desired dataset by pressing the black arrow on its left. The list of jobs will appear with the associated status (COMPLETED, RUNNING, PENDING).
Press the magnifying glass symbol at the right side of the job you want to inspect. Only plots for completed jobs can be inspected.
Go to top
Go to SPHERE-IRDIS EDPS tutorial index