Customizing the data reduction 
Selection of most appropriate calibrations
By default, EDPS associates raw calibrations to the reduction process. It is also possible to use pre-processed calibrations (a.k.a. master calibrations) if available, in order to speed up the reduction. The preference can be specified in the Raw Data tab, before creating the datasets (see here).
Possible values of the Calibration Preferences are:
raw_per_quality_level: At equal quality of reduction, association of raw calibrations is preferred. This is the default.
master_per_quality_level: At equal quality of reduction, association of master calibrations is preferred.
raw. Association of raw calibration is preferred, despite the quality of results.
master. Association of master calibration is preferred, despite the quality of results.
When master calibrations are used, the reduction step needed to process raw calibrations are not executed. The reduction then moves directly to the process of scientific exposures.
For example, if reduction speed for a quick check is preferred over a high quality reduction, one can select “master”. In this case, old master calibrations are associated even if there are raw calibrations closer in time (and therefore more likely to ensure better quality products).
The quality level that the selected calibrations deliver is indicated close to each dataset in the
Raw input tab, under the colum CalibLevel. CalibLevel=0 indicates that
calibrations that follow the rules of the instrument calibration plans have
been selected. The higher the number, the poorer the quality of the products.
More information on the application properties file can be found here.
More explanations on the concept of “association levels” can be found here.
Quality reports
Almost all processing tasks can display the input raw frames and the products in the so called “quality plots”, which
can be inspected from the Reduction Queue window.
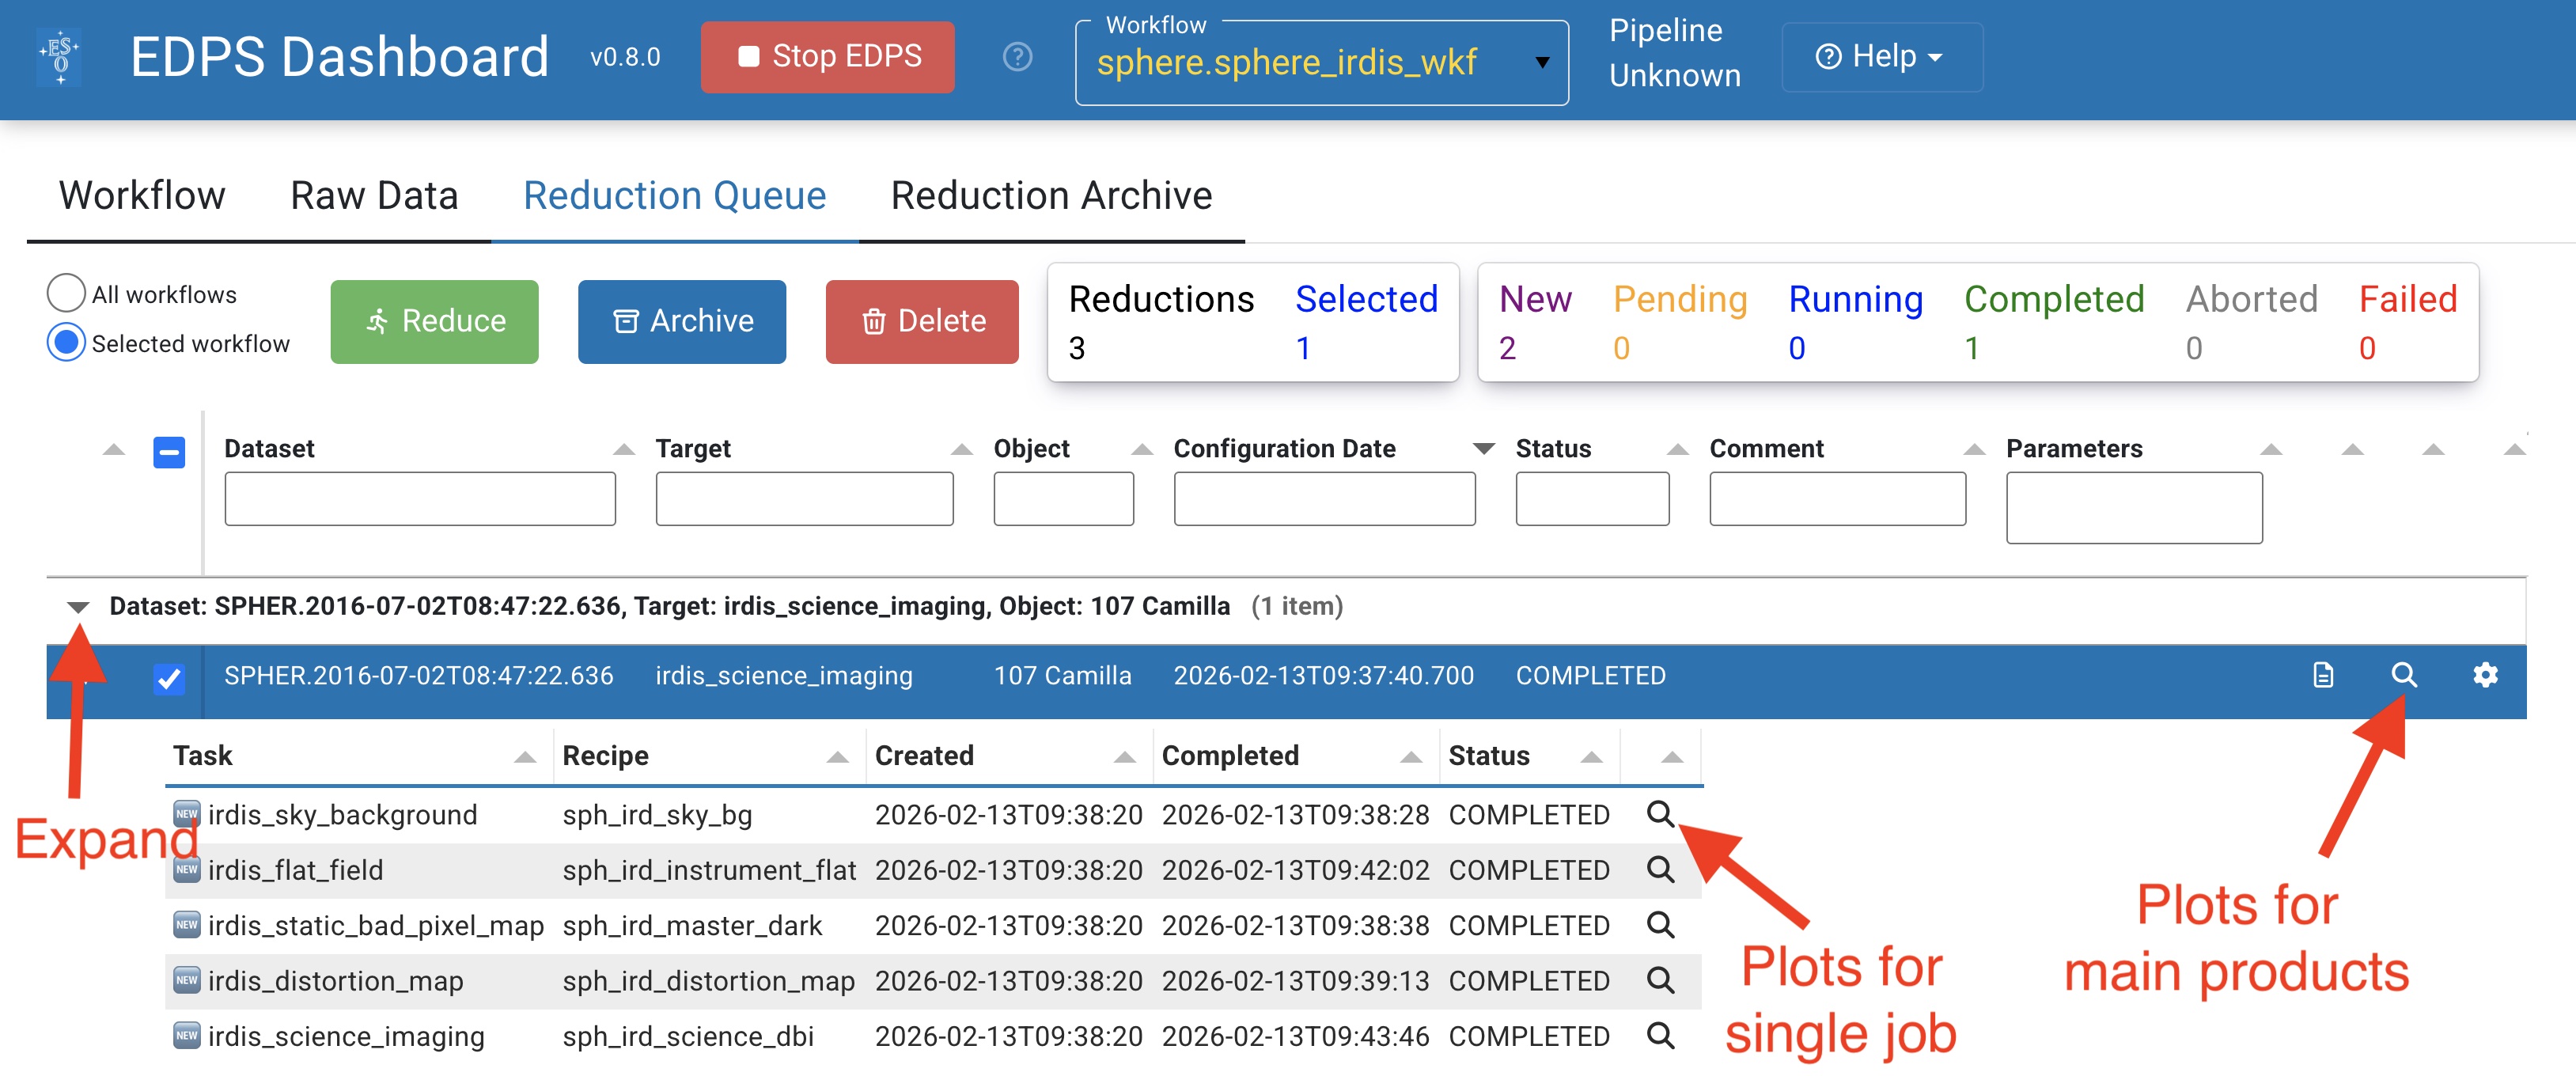
Those associated for the main product can be inspected by pressing the magnifying glass symbol at the right side of each dataset.
To inspect those associated to each individual job (if created),
Expand the desired dataset by pressing the black arrow on its left. The list of jobs will appear with the associated status (COMPLETED, RUNNING, PENDING)
Press the magnifying glass symbol at the right side of the job you want to inspect. Only plots for completed jobs can be inspected.
Configuration of parameters
The data reduction of each dataset can be configured according to the scientific needs using an appropriate configuration editor. This editor allows to configure the data reduction for a given dataset by specifying workflow and recipe parameters.
The EDPS workflows contain two types of parameters and they both have default values that can be modified to improve the data reduction.
Workflow parameters are global and they are applied to the entire workflow. They are accessible both in the
Raw Datatab, prior to the creation og a dataset, and in theReduction Configurationeditor, in theReduction queuetab. Note: some workflow parameters were already configured before creating the dataset and sending it to the reduction queue. Here, they can be changed again. Please, note that the parameters have an effect only on the files that are already in the dataset. If one specifies a parameter that should include extra files in the dataset (e.g., the inclusion of more calibrations), files are not added and the reduction might fail. If you need to change a parameter that modifies the dataset content, please go back to the Raw data tab and create a new dataset.Recipe parameters are specific to the individual recipes and can be configured per task. They are accessible in the
Reduction Configurationeditor, in theReduction queuetab.
To open the Reduction configuration editor, click on
the wheel button  next to the dataset you desire to configure the reduction for. A window with the
configuration editor appears as shown the figure below.
next to the dataset you desire to configure the reduction for. A window with the
configuration editor appears as shown the figure below.
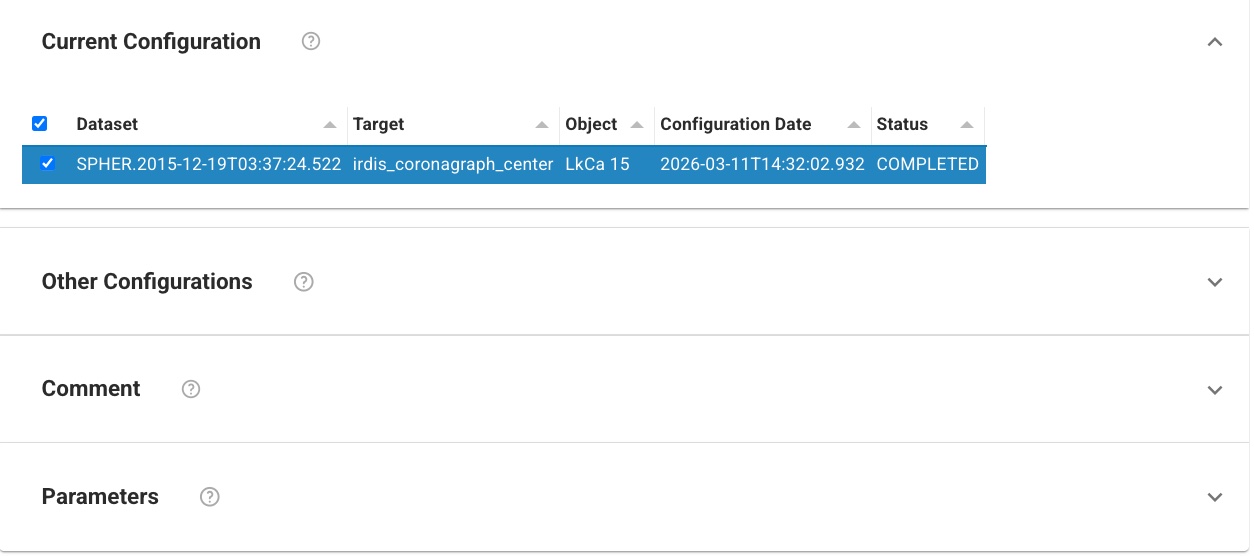
Fig. 4 The Reduction Configuration editor.
The editor is divided into 4 parts, which can be accessed pressing the corresponding expansion arrow.
Current configuration It indicates the name of the selected configuration for a given dataset.

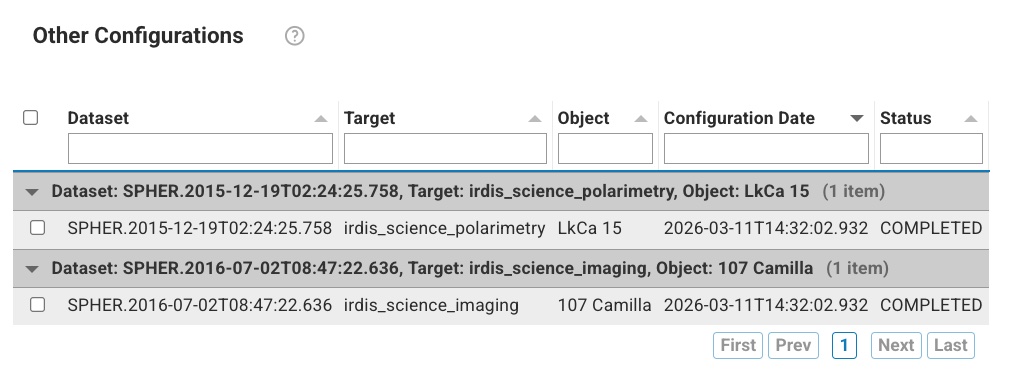
Other configurations It allows to specify other configurations, to which the changes shall be copied to.
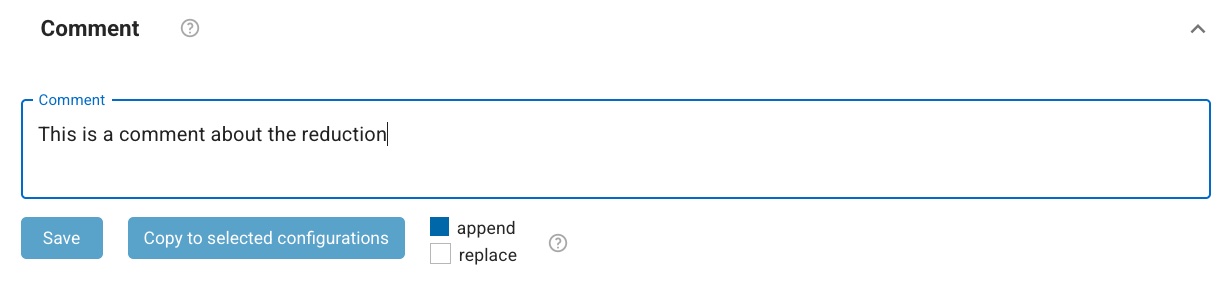
Comment It allows to specify a comment to describe the configuration. It is possible to append or replace a comment. Comments can be changed on all configurations. It is possible to save the comment for the current configuration only, or for all the selected configurations.
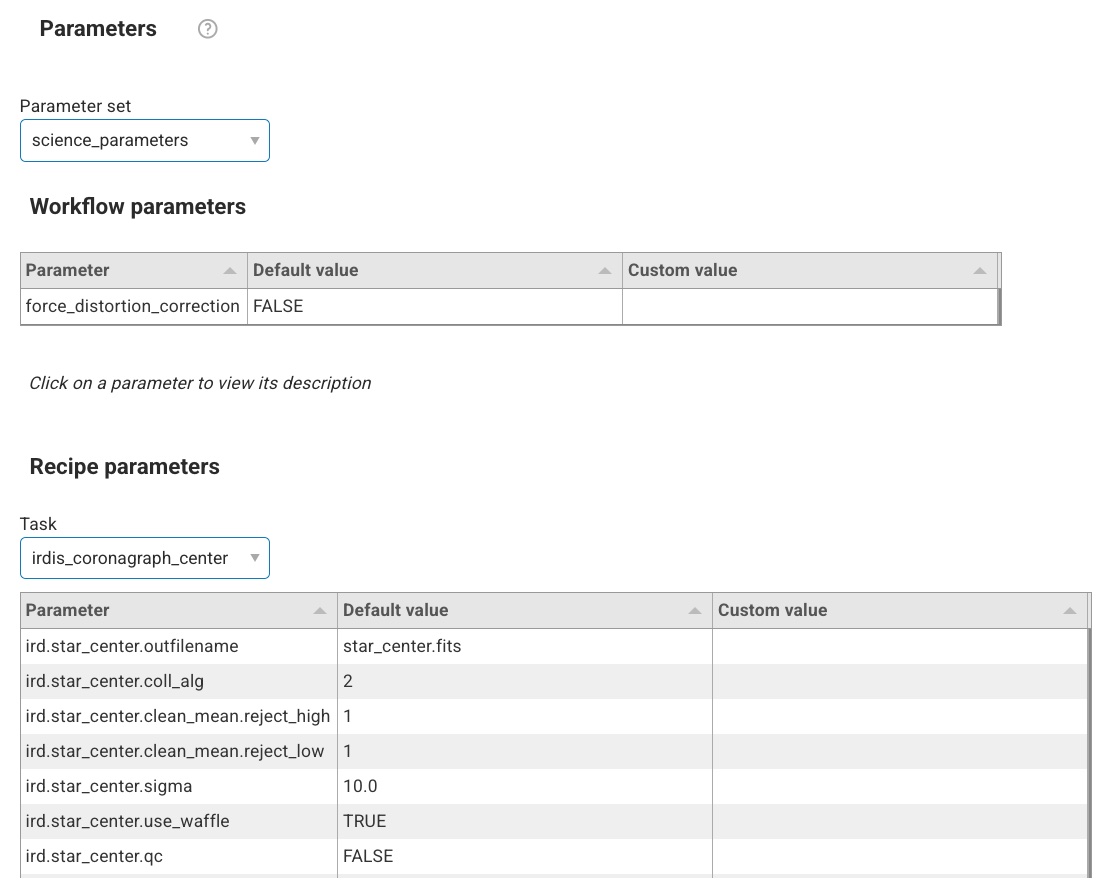
Parameters
This window is visible allows to:
Select the parameter set. A pre-determined list of workflow parameters and recipe parameters for a given use case. For the majority of the cases, the “science” parameter set can be used.
Edit the workflow parameters. These are parameters that regulates the reduction strategy, e.g. whether to use a given calibration or not, or to trigger a certain reduction step. Note that if the changes imply that some files not in the dataset are needed, the reduction might fail. In case, go back to the raw data tab, edit the workflow parameters there, and recreate the datasets.
Edit the recipe parameters. These are parameters associated to the recipe of a given task. Note: the same recipe parameters can be configured differently for the tasks that run the same recipe. Default parameters are shown (albeit some parameters can be dynamic, e.g.
EDPSchanges their value depending on the type of input data).
Change the values according to the needs and then select whether to save it to the current or the selected configurations. Note, complete configurations cannot be modified, new configurations will be automatically created instead.
Configuration and troubleshooting 
This section provides guidance on configuring the reduction, as well as diagnosing and resolving common issues encountered during the SPHERE-IRDIS data-reduction cascade.
Dark regions in the background 
Fig. 5 shows an example of dark regions appearing in the products of the imaging workflow. These features are caused by astrophysical sources present in the SKY frames used for background subtraction.
If SKY frames are not provided to the pipeline, dark frames are used instead for the background correction, which removes this pattern.
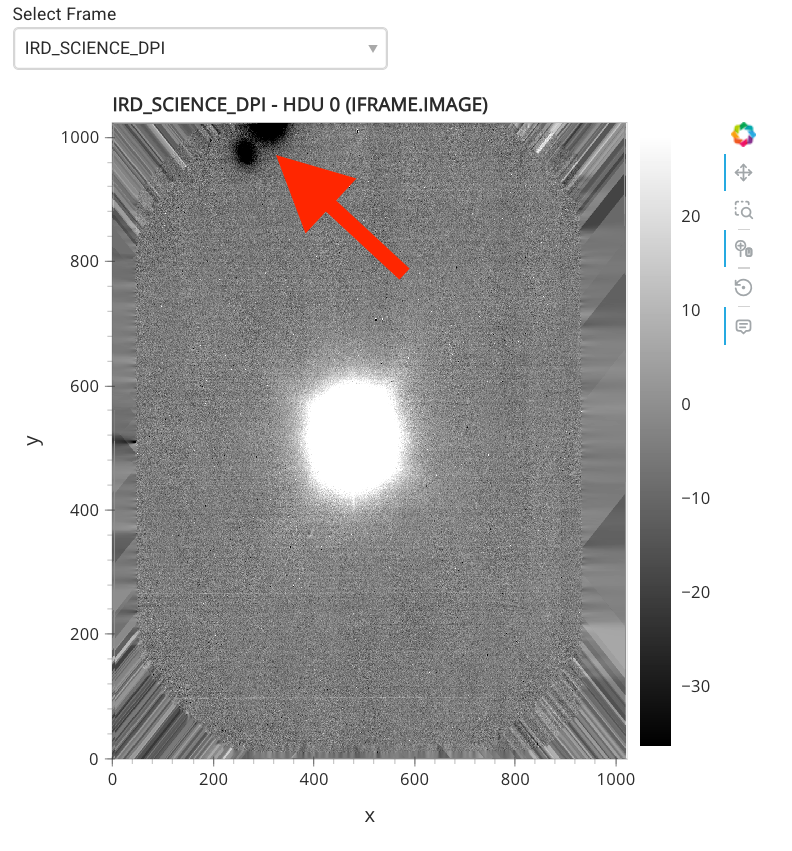
Fig. 5 Dark regions in the final image product for SPHER.2015-12-19T02:24:25.758_tpl (DPI).
Fine tuning the instrument flat 
The recipe sph_ird_instrument_flat is executed using modified bad-pixel rejection thresholds.
Instead of the default values of 0.1 and 10 for ird.instrument_flat.badpix_lowtolerance
and ird.instrument_flat.badpix_uptolerance, respectively, values of 0.75 and 1.25 are adopted.
For K-band data, the High Contrast Data Center
recommends increasing ird.instrument_flat.badpix_uptolerance to 1.5.
Distortion map are not used 
The pipeline recipe sph_ird_distortion_map determines the geometric distortion
of IRDIS data using internal calibration observations obtained with a pinhole mask.
The recipe can also measure the relative offset between the LEFT and RIGHT detector
images when the workflow parameter force_distortion_correction is enabled.
In practice, distortion solutions derived from internal calibration data have been found to be insufficiently robust for routine processing. Calibration sequences acquired close in time may produce noticeably different distortion solutions, including variations in the derived geometric mapping. When applied to science or astrometric observations, these solutions generally do not improve the calibration beyond what is achieved using a simple anamorphism correction alone, and in some cases may even degrade the data.
For this reason, processing of internal distortion calibrations is disabled. A more robust approach is to correct only the dominant distortion component, which is a stable anamorphism of approximately 0.6%. This can be applied in a simple and reproducible manner by rescaling the detector coordinates, multiplying the X and Y axes by factors of 1.0059 and 1.0011, respectively.
Waffle spots cannot be detected 
In task irdis_coronagraph_center, the recipe sph_ird_star_center
may require parameter adjustments depending on the observing setup.
For K-band data, the detection of waffle spots can be challenging
due to the high thermal background.
Increasing ird.star_center.sigma to 100 may improve the detection.
Alternatively, the background can be removed manually prior to running the recipe.
The default parameters are optimized for detecting waffle spots in coronagraphic observations.
For data acquired without a coronagraph, the following parameters should be modified:
ird.star_center.use_waffle=FALSE,ird.star_center.sigma=500(the stellar PSF is typically very bright in this configuration).
Angular Differential Imaging and Spectral Differential Imaging 
The recipe sph_ird_science_dbi runs with both ADI and SDI disabled by default.
If SDI processing is enabled, the Data Centre (DC) recommends setting
ird.science_dbi.minr and ird.science_dbi.maxr to 20 and 70, respectively,
instead of the default values of 4 and 40.
These values are calibrated for a wavelength of λ = 1.6 µm and should be scaled linearly with wavelength for other observing bands.
Getting additional data products 
The recipe sph_ird_science_dbi is used to process both Classical Imaging (CI)
nd Dual-Band Imaging (DBI) data.
The workflow is configured to save stacked products for each detector arm
(ird.science_dbi.save_addprod = TRUE) while intermediate products
are not retained by default.
To generate and preserve all intermediate products that may be useful for further analysis,
set the recipe parameter ird.science_dbi.save_interprod = TRUE.
Go to top
Go to SPHERE-IRDIS EDPS tutorial index